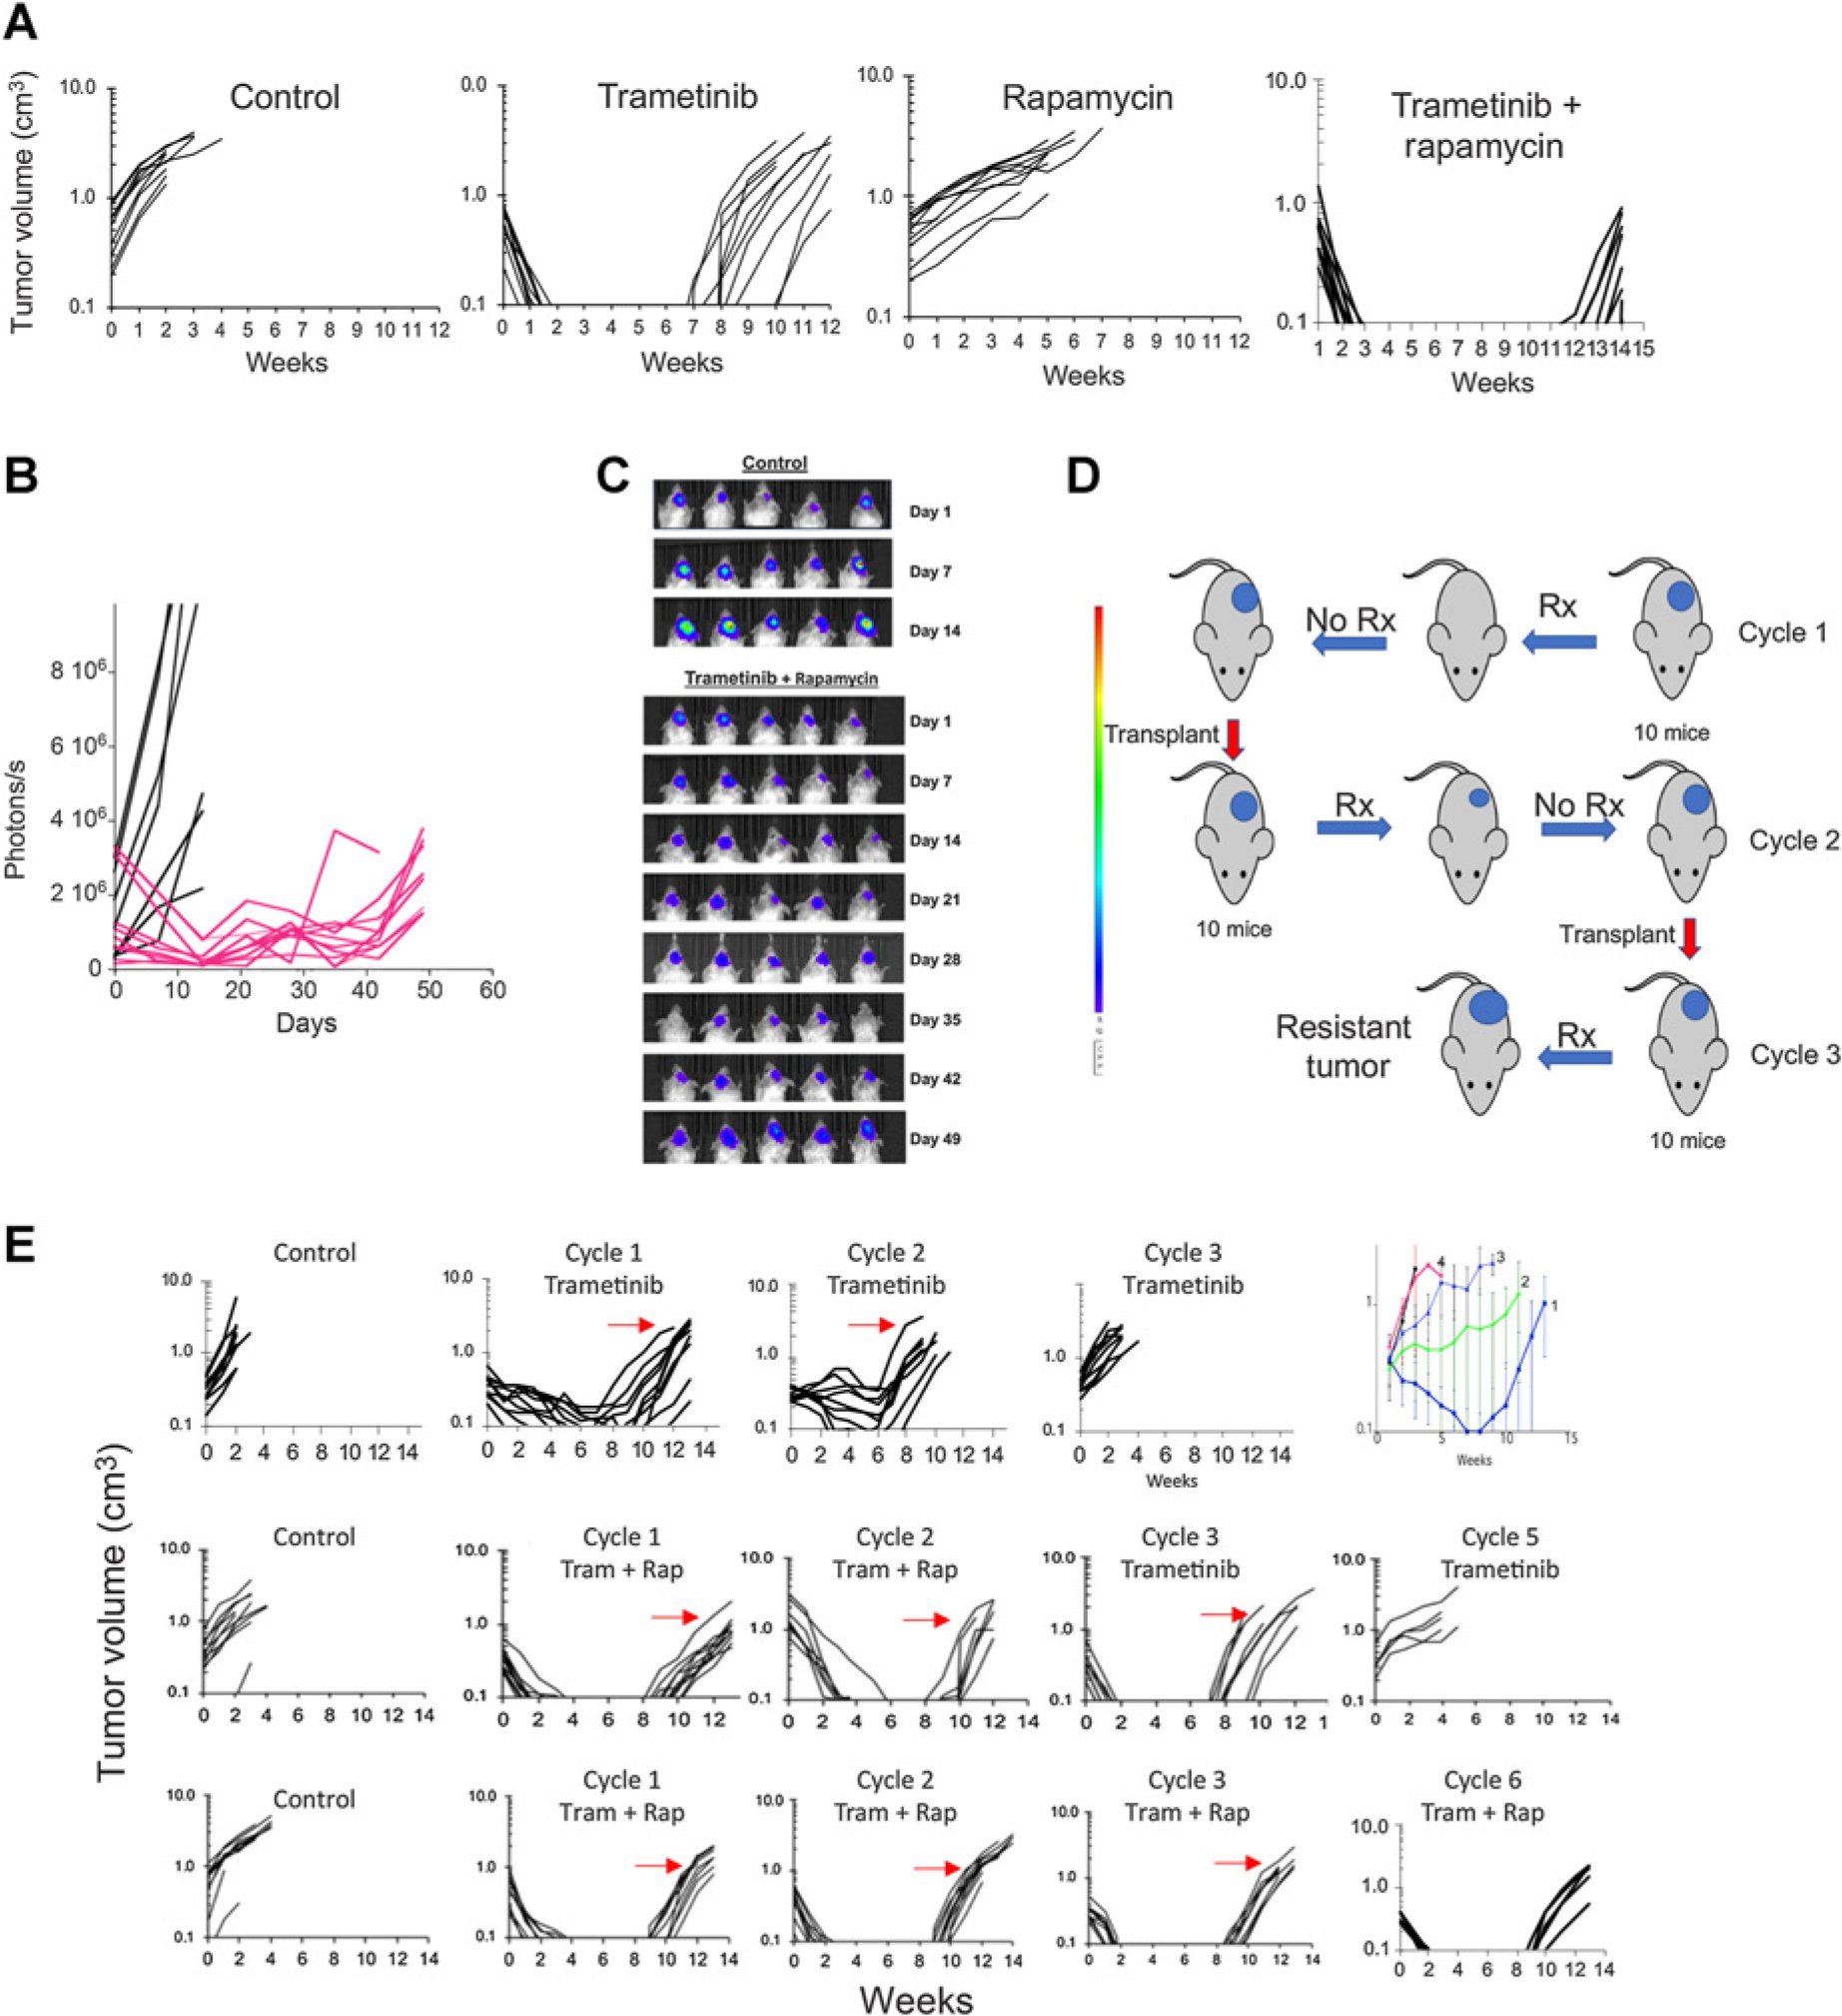
Figure 3.

Sensitivity and development of acquired resistance in BT-40 BRAF-mutant xenografts to trametinib, rapamycin, or the combination. A, Responses of BT-40 PDX. Mice bearing subcutaneous BT-40 tumor were randomized to receive no treatment, trametinib (1 mg/kg daily × 42 days), rapamycin (5 mg/kg daily × 5 for 6 consecutive weeks), or the combination. Each curve shows the growth of an individual tumor. B, Activity of the trametinib–rapamycin combination on intracranial BT-40/Luc tumors. 105 BT-40/Luc cells expressing luciferase were implanted intracranially. Mice were randomized into control or treatment groups when the BLI value reached >1 × 10⁵ photons/sec/cm3 and received combination treatment as in (A). Mice were imaged once weekly to ascertain tumor growth. Individual tumor growth curves based on BLI emission. Control (black), treated (Red) BLI values plotted against time for control and treatment groups. C, Luciferase images of cranial tumor growth in control and treatment groups. D, Schema for developing drug resistance in mice. E, Top, Responses of BT-40 xenografts to three cycles of trametinib treatment (1 mg/kg/day for 42 consecutive days). The arrows indicate the tumor that was transplanted into recipient mice for the subsequent cycle of treatment. Top right panel, mean tumor volume (±SD) for cycles 1 to 4 of treatment; Center panels, Responses of BT-40 xenografts for two cycles of trametinib + rapamycin (trametinib 1 mg/kg daily × 42, rapamycin 5 mg/kg daily × 5 for 6 consecutive weeks). After two cycles of treatment, single agent trametinib was administered for three further cycles; Bottom panels, Responses of BT-40 xenografts for six cycles of trametinib + rapamycin (trametinib 1 mg/kg daily × 42, rapamycin 5 mg/kg daily × 5 for 6 consecutive weeks). Each curve represents the growth of a single tumor. The arrows indicate the tumor that was transplanted into recipient mice for the subsequent cycle of treatment. s, second; Rx, treatment; Tram, trametinib; rap, rapamycin.
