
Figure 1. Integrated metabolomics and transcriptomics data analysis of human kidney samples.
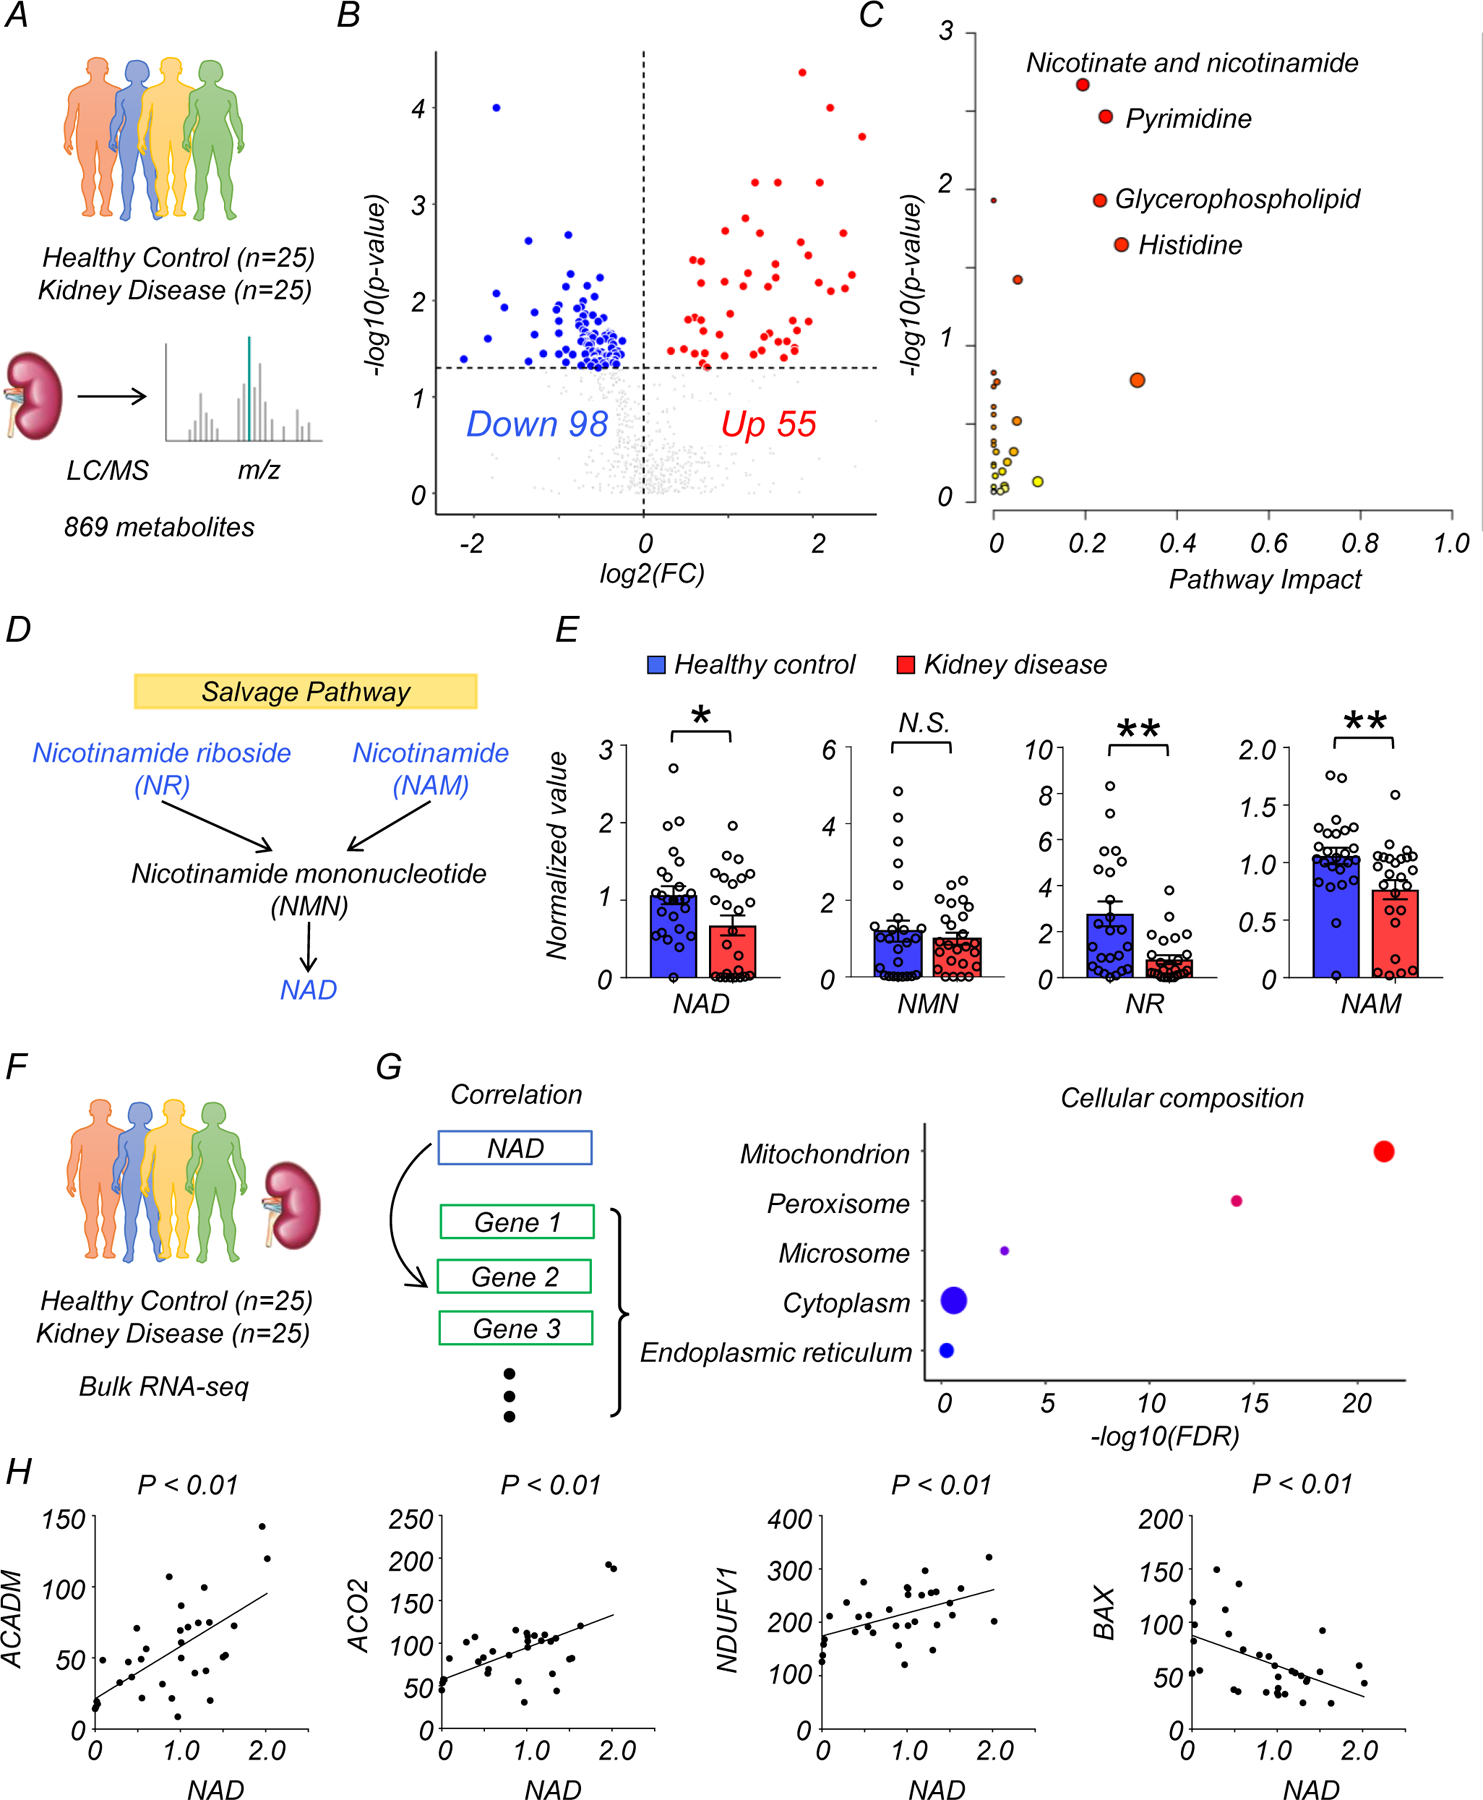
(A) Total of 50 human kidney samples were collected for metabolomics analysis; including healthy controls (n=25) and patients with kidney disease (n=25).
(B) Volcano plot of metabolites showing significant changes in human diseased kidneys. x-axis: log2 fold change (log2FC). Y-axis: -log10(p-value). Color indicates metabolites significantly higher (red) or lower (blue) in human diseased kidneys. Welch’s two-sided t-test was used to calculate p-value.
(C) Metabolic pathways showing significant changes in diseased kidneys. The dot color indicates the level of significance, the dot size indicates pathway impact. p-value was calculated from the enrichment analysis in Metaboanalyst.
(D) The simplified NAD salvage pathway. Blue indicates metabolites significantly lower in human diseased kidneys.
(E) The levels of NAD+, NMN, NR, and NAM in human kidneys (Healthy control n=25. Kidney disease n=25). * p<0.05. N.S. not significant. Data are presented as mean ± s.e.m. and were analyzed using Welch’s two-sided t-test.
(F) The bulk RNA-seq of same human kidney samples used for metabolomic studies.
(G) Gene ontology analysis of cellular composition of genes significantly correlating with kidney NAD+ levels. The dot color and size indicate significance and gene counts, respectively.
(H) The correlation between kidney NAD+ levels (x-axis) and relative genes expression (y-axis) encoding mitochondrial proteins. P-value was calculated using Pearson’s correlation.