
Extended Data Fig. 8. RIG-I depletion protected from kidney injury, cell death, and inflammation.
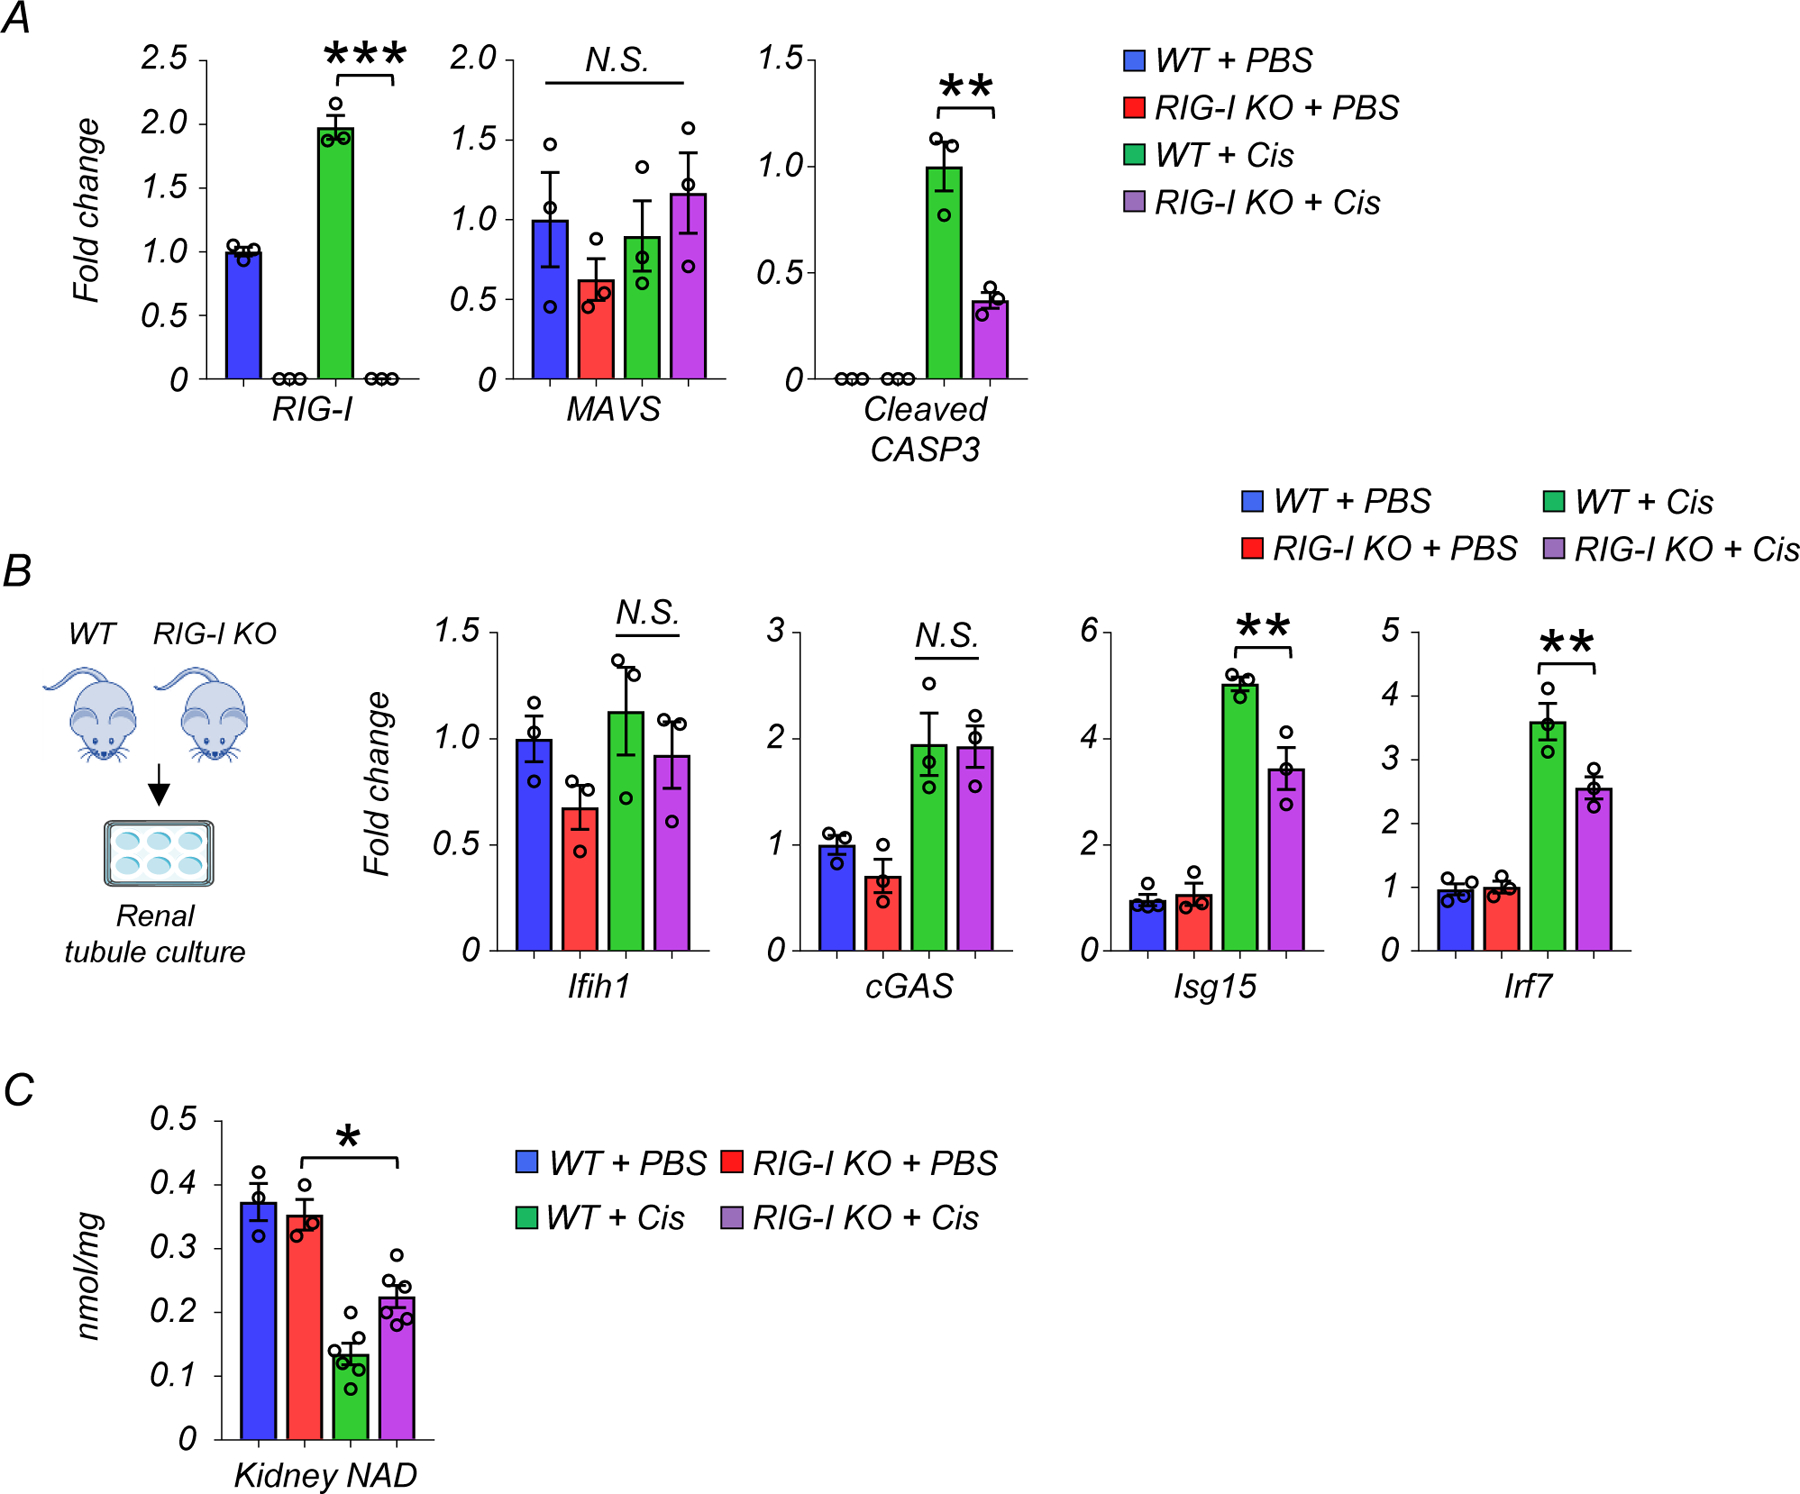
(A) Western blot quantification of RIG-I, MAVS, cleaved caspase-3 (cCASP3) in mice kidneys in indicated groups (n=3 in each group). *p<0.05, ***p<0.001. N.S. not significant.
(B) Experimental design. Renal tubule cells were isolated from WT and RIG-I KO mice. Relative transcript levels of Ifih1, cGAS, Isg15 and Irf7 in renal tubule cells of experimental groups (n=3 in each group). Gene expression levels were normalized to Gapdh. *p<0.05. N.S. not significant.
(C) Kidney NAD+ levels in experimental groups (WT + PBS n=4. RIG-I KO + PBS n=4. WT + Cis n=6. RIG-I KO + Cis n=6). *p<0.05.
Data are presented as mean ± s.e.m. and were analyzed using a one-way ANOVA followed by Tukey post hoc test for multigroup comparison.