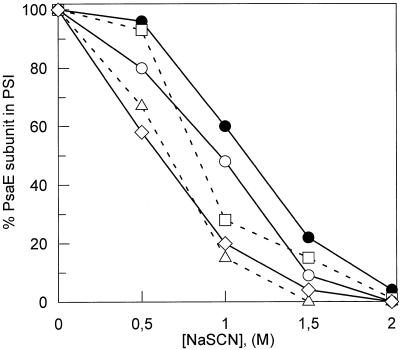
Figure 5.
Plots of the PsaE subunit bound to membrane-inserted PSI as a function of NaSCN concentration. Amounts of PsaE subunit remaining associated to PSI after NaSCN washing were quantified by western blotting followed by enhanced chemiluminescence detection and densitometric measurement of an exposed light-sensitive film. For each sample, remaining PsaE is expressed as the percent of the initial amount present after the control washing without chaotropic salt. ●, WT PSI; □, D10 PSI; ▵, DE PSI; ○, DF PSI; ⋄, DΔCt PSI.

