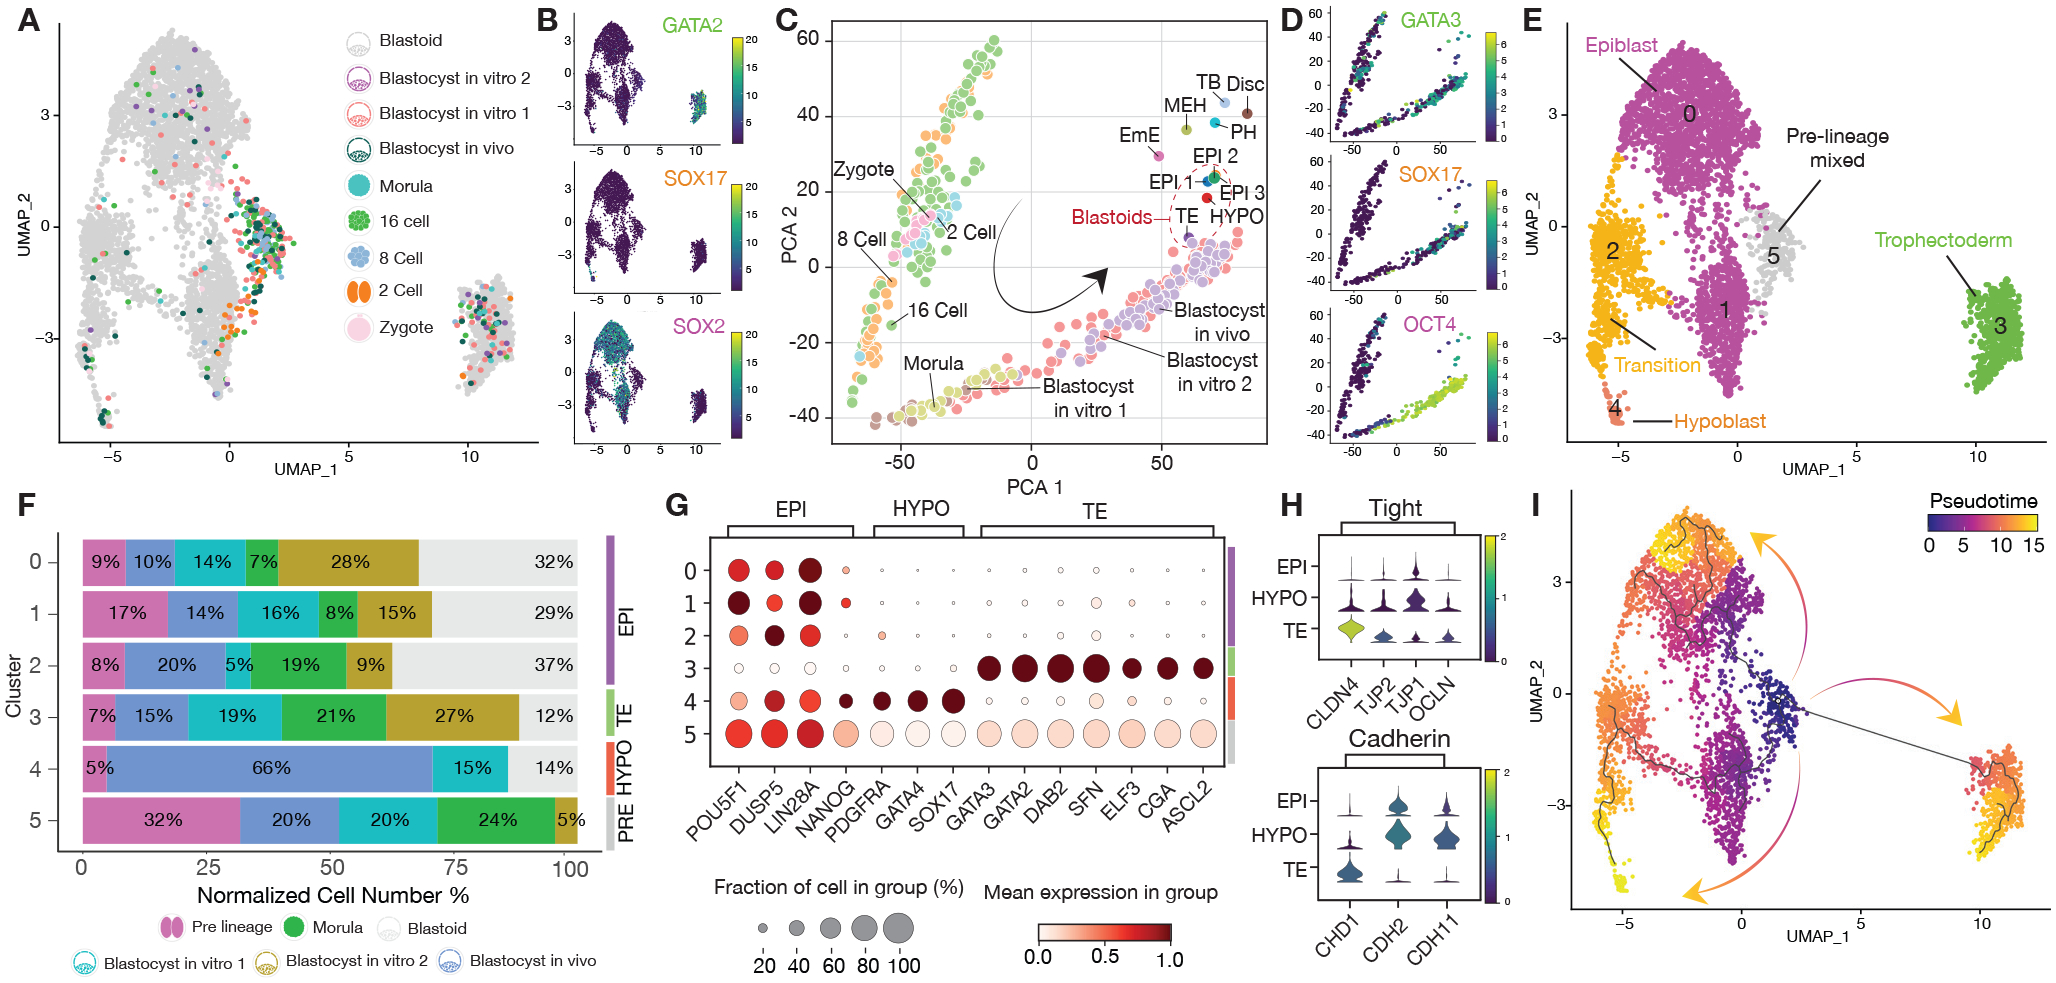
Figure 2. Single-cell characterization of bovine assembled blastoids.

(A) Joint uniform manifold approximation and projection (UMAP) embedding of 10x Genomics single-cell transcriptomes of bovine blastoids (grey) and bovine zygote (pink), 2 cell (orange), 8 cell (blue), 16 cell (green), Morula (cyan) and in vivo and in vitro Blastocyst stage embryos (purple, dark green, light red). (B) UMAP Heatmap showing expression of Trophectoderm (TE), Hypoblast (HYPO), and epiblast (EPI) markers, GATA2, SOX17 and SOX2, respectively. (C) Principal component analysis (PCA) of pseudo bulk conversion of blastoid data. Gastrulation markers31: Disc: Embryonic disc (Day 14 Stage 4). EmE: Embryonic ectoderm (Day 14 Stage 5). MEH: Mesoderm, endoderm, and visceral hypoblast. (Day 14 Stage 5). PH: Parietal hypoblast. (Day 14 Stage 5). TB: Trophoblast. (Day 14 Stage 5). (D) PCA heatmaps showing expression of Trophectoderm (TE), Hypoblast (HYPO), and epiblast (EPI) markers, GATA3, SOX17 and OCT4 (also known as POU5F1), respectively. (E) Major cluster classification based on marker expression. (F) Normalized percentage of cells in each cluster. (G) Dot plot indicating the expression of markers of epiblast (EPI), trophectoderm (TE) and hypoblast (HYPO). (H) Violin plot of lineage-specific cell junction markers. (I) RNA velocity pseudotime analysis depicting the cell trajectories.
