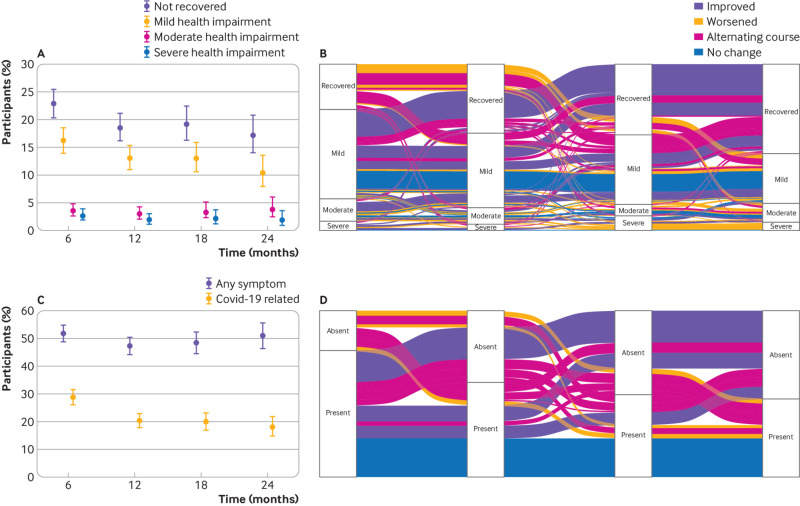
Fig 2.
(A) Proportions and 95% confidence interval of participants who had not recovered (overall) and with mild, moderate, and severe health impairment at months 6, 12, 18, and 24 after infection. Inverse probability of censoring weighting was applied to all estimates. (B) Alluvial plot showing the transition of participants across the different health states over time (among participants with complete data at all time points and excluding those who reported continued recovery at all follow-up time points). The width of the flow corresponds to the weighted proportion of participants and colours represent the overall trajectory between six and 24 months. (C) Proportions and 95% confidence intervals of participants with any symptom (regardless of whether they were related to covid-19) and symptoms reported by participants to be related to covid-19 at months 6, 12, 18, and 24 after infection. Inverse probability of censoring weighting was applied to all estimates. (D) Alluvial plot showing the transition between presence and absence of self-reported covid-19 related symptoms over time (among participants with complete data at all time points and excluding those who were symptom-free at all follow-up time points). The width of the flow corresponds to the weighted proportion of participants and colours represent the overall symptom trajectory between six months and 24 months

