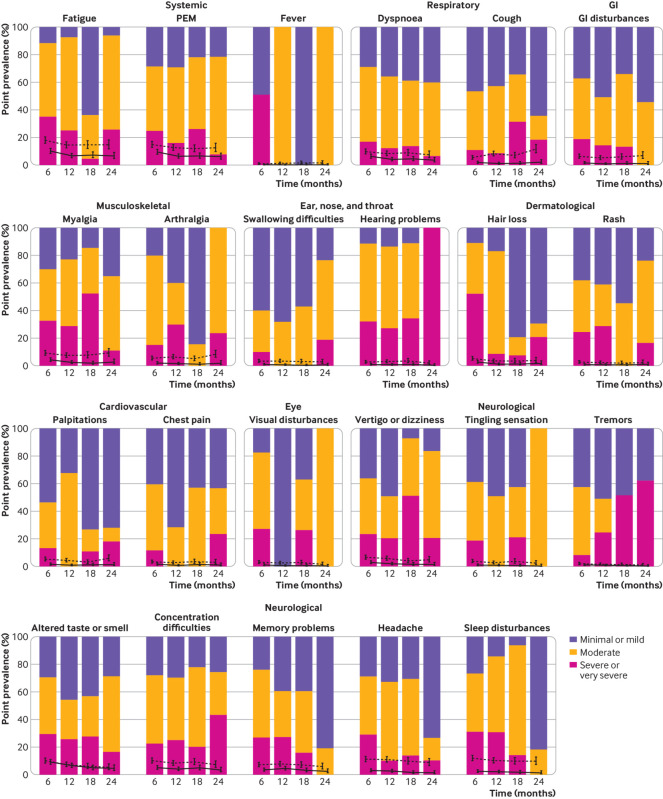
Fig 3.
Point prevalence and severity of 23 prespecified symptoms at months 6, 12, 18, and 24 after SARS-CoV-2 infection, grouped by body organ system. Error bars show the prevalence and 95% confidence interval for each of the symptoms. Inverse probability of censoring weighting was applied to all estimates. Solid lines refer to symptoms reported by participants to be related to covid-19. Dotted lines refer to all reported symptoms regardless of whether they were reported to be related to covid-19. Stacked bar plots show self-reported severity of symptoms reported to be related to covid-19 (as a proportion of all reported symptoms). PEM=Post-exertional malaise; GI=gastrointestinal

