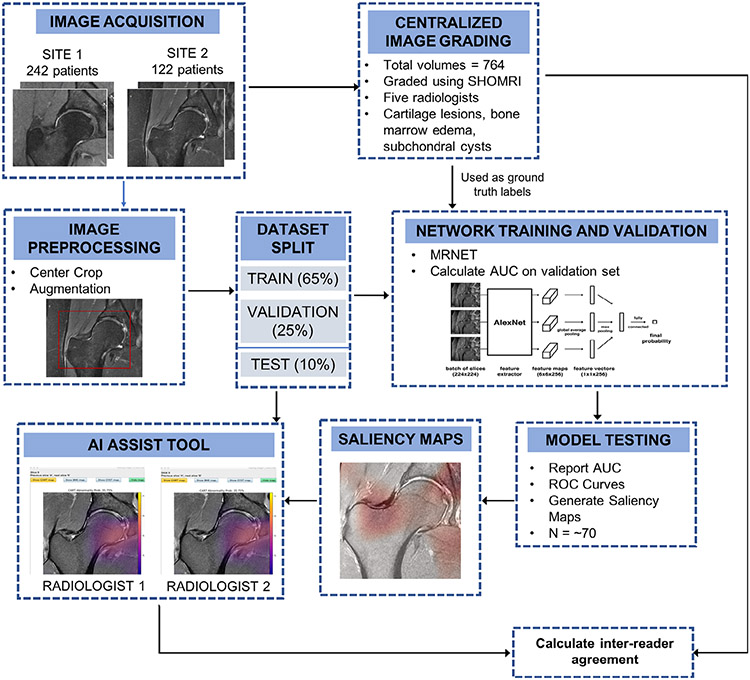
FIGURE 1:
Method and analysis pipeline. Images were acquired at two different sites, and a centralized image grading was performed using the SHOMRI grading system for each pathology. These grades were used as ground truth labels in network training, validation, and testing. All the images underwent image preprocessing and augmentation if needed. The dataset was split into training, validation, and testing groups. Three networks were trained separately for each pathology, using the MRNET architecture. Models that had an AUC greater than 0.7 were selected and used for testing the network performance on the test dataset, while also generating saliency maps. These maps were loaded into the AI assist tool, used by two radiologists. The interreader agreement was calculated between the two radiologists for each pathology.

