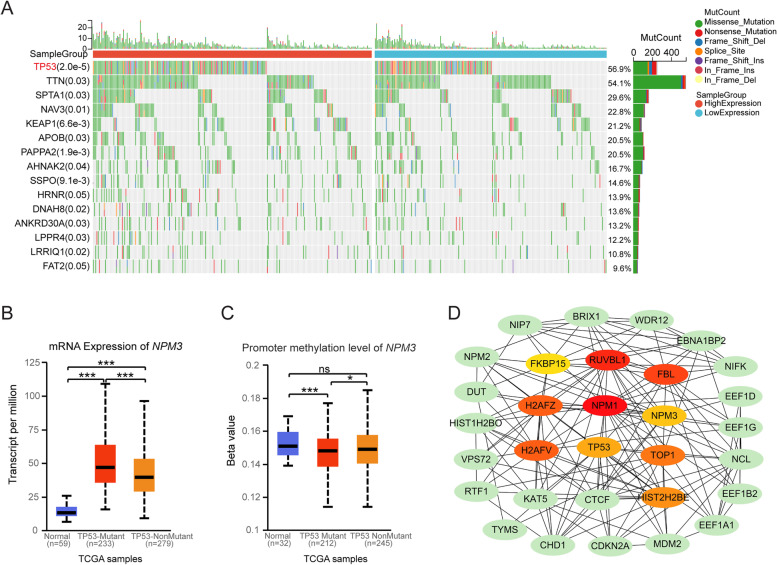
Fig. 3.
Relationship between NPM3 expression and gene mutation landscape. A Relationship between NPM3 expression and gene mutation landscape was analyzed through the Sangerbox database. B-C NPM3 mRNA expression and promoter methylation levels upon TP53 mutation were analy zed through the UALCAN database. D The interacting protein network of NPM3 was analyzed through the STRING database and Cytoscape 3.9.1 software. The top ten important nodes are highlighted based on Betweenness Centrality parameter. Chi-square test was used to assess differences in the frequency of gene mutations. The Mann–Whitney U test was used to assess the significance of observed differences. * P < 0.05 and *** P < 0.001 were considered significant, ns, no significance

