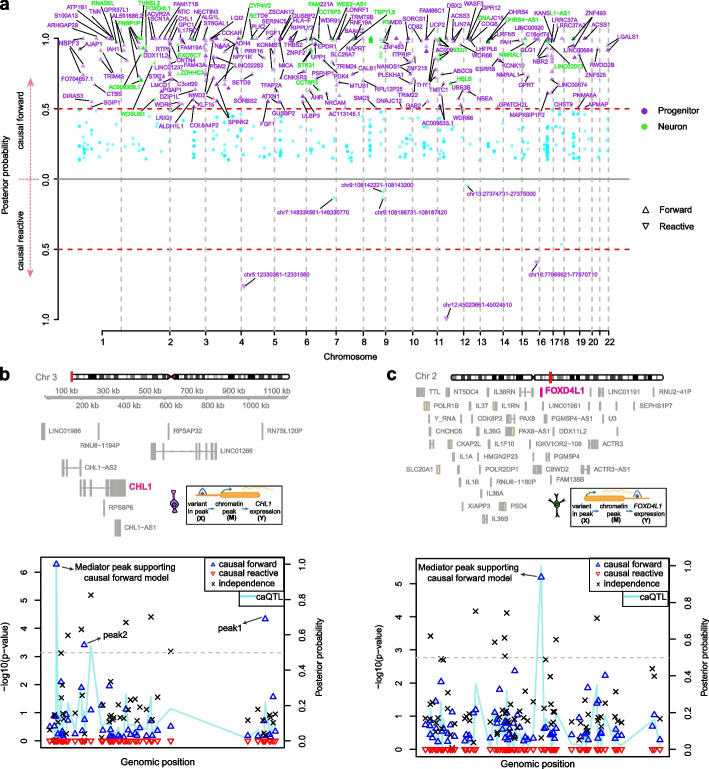
Fig. 2.
Cell-type-specific gene regulation mediated by chromatin accessibility. a Manhattan plot showing the bmediatR results for the causal forward model (upper), and for the causal reactive model (lower) for each cell type (purple for progenitor, green for neuron, purple + green for genes detected in both cell types). Gene symbols and chromatin-accessible regions are shown. b Mediation scan plot overlaid with caQTL data for the causal forward model of epigenetic regulation of CHL1 gene expression in progenitors indicated by lines in different colors with corresponding caQTL p-value on the left y-axis, and the bmediatR posterior probability of each possible model is shown with different shapes on the right y-axis. The locations of peak harboring the variant, peak1 and peak2 supporting the causal forward model are highlighted. Dashed line indicates posterior probability = 0.5. c Mediation scan plot overlaid with caQTL data for the causal forward model of epigenetic regulation of FOXD4L1 gene expression in neurons. Line and shapes are assigned as part b. Dashed line indicates posterior probability = 0.5

