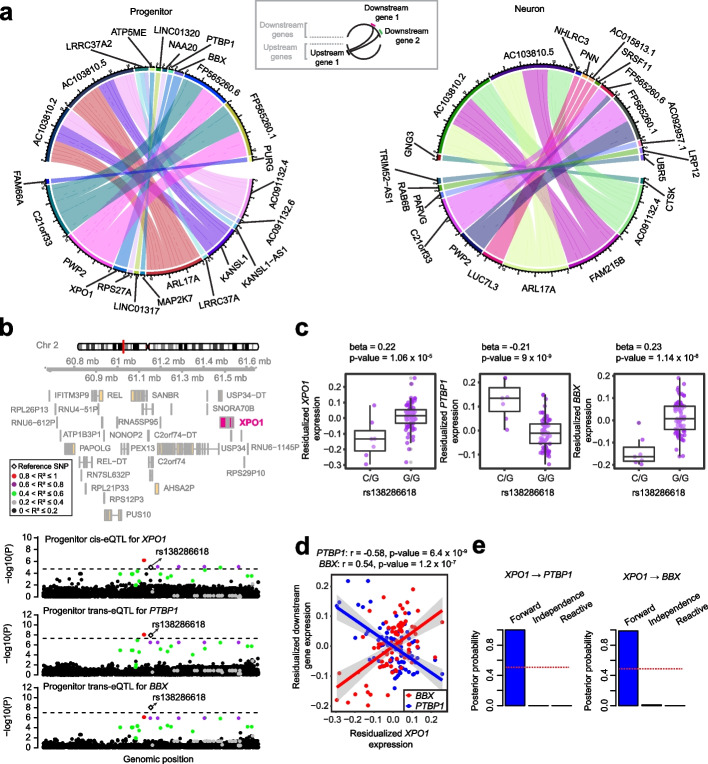
Fig. 4.
Cell-type-specific gene expression mediated by trans-regulation. a Circle plots illustrating genes mediated by trans-regulation in progenitors (left) and in neurons (right). Upstream genes (external circle color matches line color) are shown interacting with downstream genes (external circle color does not match line color). b Genomic tracks illustrating the association of variants cis-regulating XPO1 upstream gene with the expression XPO1, and downstream genes PTBP1 and BBX. Data points were colored based on the pairwise LD r2 with the rs138286618 (reference SNP). Dashed lines indicate the p-value threshold for significance in cis-eQTL or trans-eQTL analysis. c Boxplots showing the relationship between expression of genes residualized by the covariates and rs138286618 variant. d Correlation between XPO1 vs PTBP1 genes and XPO1 vs BBX genes. Residualized expression by covariates are shown for all genes. e bmediatR posterior probability for causal forward, independence versus causal reactive models for the regulation of PTBP1 and BBX genes by XPO1. Posterior probabilities of causal reactive were set to zero by bmediatR since reactive model priors were not evaluated for mediation via trans-regulation

