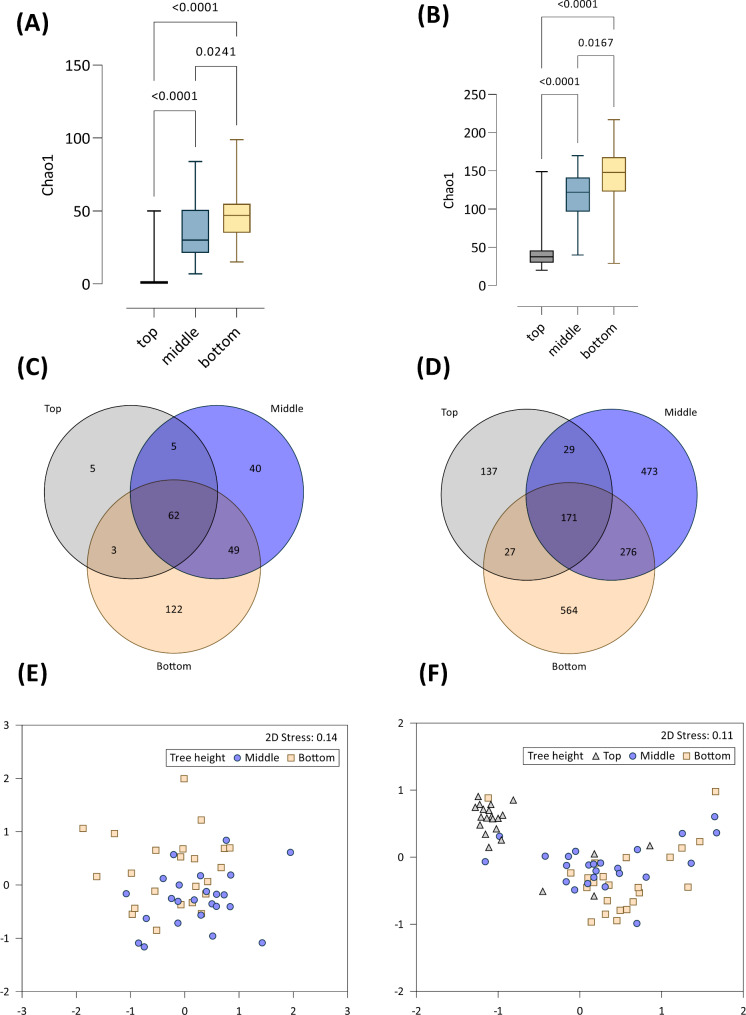
Fig. 2.
P. radiata needle microbiome α and β diversity summary plots at different tree heights. (A) bacterial ASV-based Chao1 ‘species’ richness (p = < 0.001), (B) fungal Chao1 richness (p = < 0.001), (C) bacterial Venn diagram displaying ASVs at three different canopy collection, and (D) the fungal Venn diagram also partitioned into canopy height factors. Ordinations (nMDS) using Class-level phylogenetic classification are presented in (E) for bacterial communities from the bottom and middle canopy samples only, and (F) fungal communities

