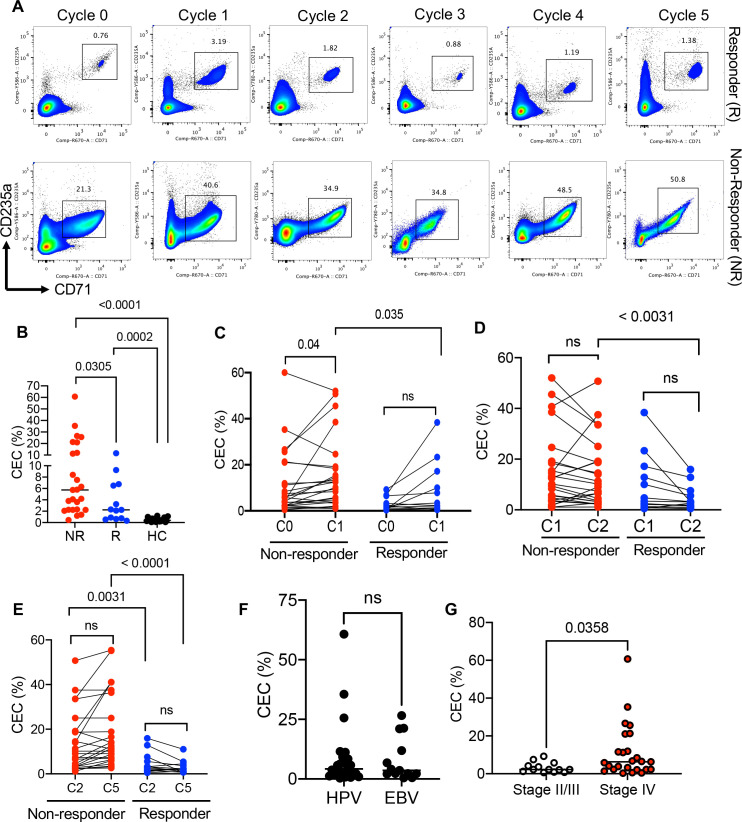
Figure 1.
A higher frequency of CECs in non-responders versus responders. (A) Representative flow cytometry plots of the percentage of CECs in PBMCs of a responder (R, n=13) versus a non-responder (NR, n=25) patient with VAST at cycle (0) or baseline, 2 weeks post valproate treatment (cycle 1), 2 weeks post avelumab therapy (cycle 2), 4 weeks (cycle 3), 6, and 8 weeks post avelumab therapy. (B) Cumulative data of the frequency of CECs in PBMCs of NR, R and HCs. (C) Cumulative data of the percentages of CECs at cycle 0 (C0) and cycle 1 (C1) in non-responders versus responders to avelumab therapy. (D) Cumulative data of the percentages of CECs at cycle 1 (C1) and cycle 2 (C2) in non-responders versus responders to avelumab therapy. (E) Cumulative data of the percentages of CECs at cycle 2 (C2) and cycle 5 (C5) in non-responders versus responders to avelumab therapy. (F) Cumulative data showing percentages of CECs in VAST-associated HPV (n=26) versus EBV (n=12). (G) Data showing the percentages of CECs in stage II/III (n=13) versus stage IV (n=25) including (IV, IVA, IVB, and IVC) of patients with VAST. Each dot represents a patient and mean±SEM, p value as indicated for each data set or not significant (ns). Non-responder (NR), responder (R), healthy control (HC), cycle (C). CEC, CD71+ erythroid cell; EBV, Epstein-Barr virus; HPV, human papillomavirus; PBMC, peripheral blood mononuclear cell; VAST, virus-associated solid tumor.

