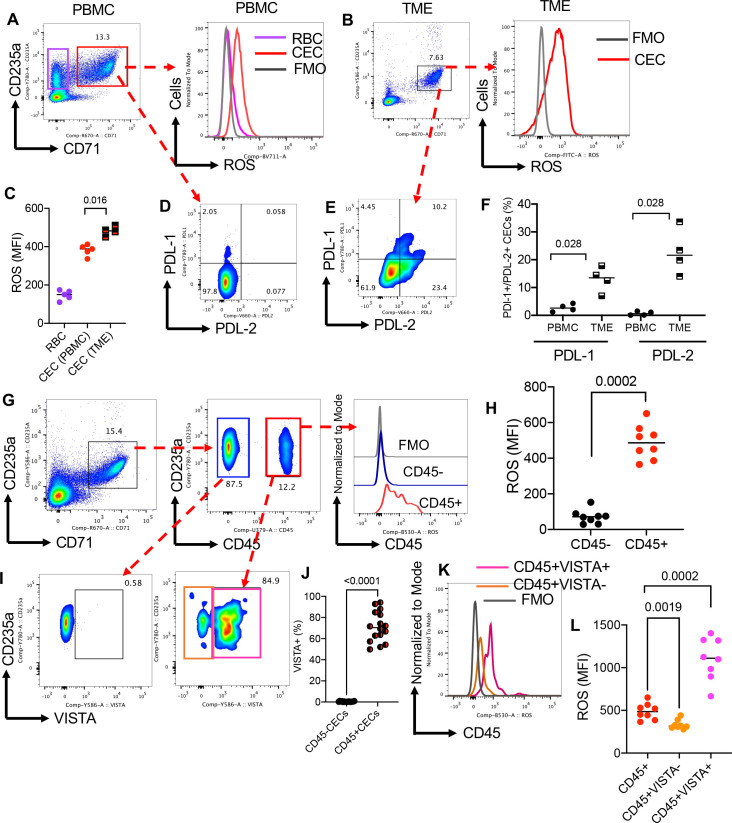
Figure 2.
CD45+CECs are the prominent cells expressing ROS and VISTA. (A) Representative plot of ROS expression in CECs versus RBCs from a PBMC sample. (B) Representative plot of ROS expression in CECs from the TME. (C) Cumulative data comparing the expression of ROS in RBCs, CECs from PBMCs and from the TME. (D) Representative plot of PD-L1-/PD-L2 expression in CECs from PBMCs, or (E) from the TME. (F) Cumulative data of percentages of PD-L1–PD-L2 expressing CECs in PBMCs versus TME. (G) Representative plots, and (H) cumulative data of ROS expression in CD45− versus CD45+ CECs of PBMCs. (I) Representative plots, and (J) cumulative data of percentages of VISTA-expressing cells within CD45− and CD45+CECs from PBMCs of patients with virus-associated solid tumor. (K) Representative plots, and (L) cumulative data of ROS expression among CD45+VISTA+ and CD56+VISTA−CECs. Cumulative data of percentages of VISTA+CECs in CD45− and CD45+CECs from PBMCs as measured by the mean fluorescence intensity (MFI). Each dot represents a patient and mean±SEM, p value as indicated for each data set or not significant (NS). CEC, CD71+ erythroid cell; FMO, fluorescence minus one; PBMC, peripheral blood mononuclear cell; PD-L1, programmed death-ligand 1; RBC, red blood cells; ROS, reactive oxygen species; VISTA, V-domain Ig suppressor of T-cell activation; TME, tumor microenvironment.

