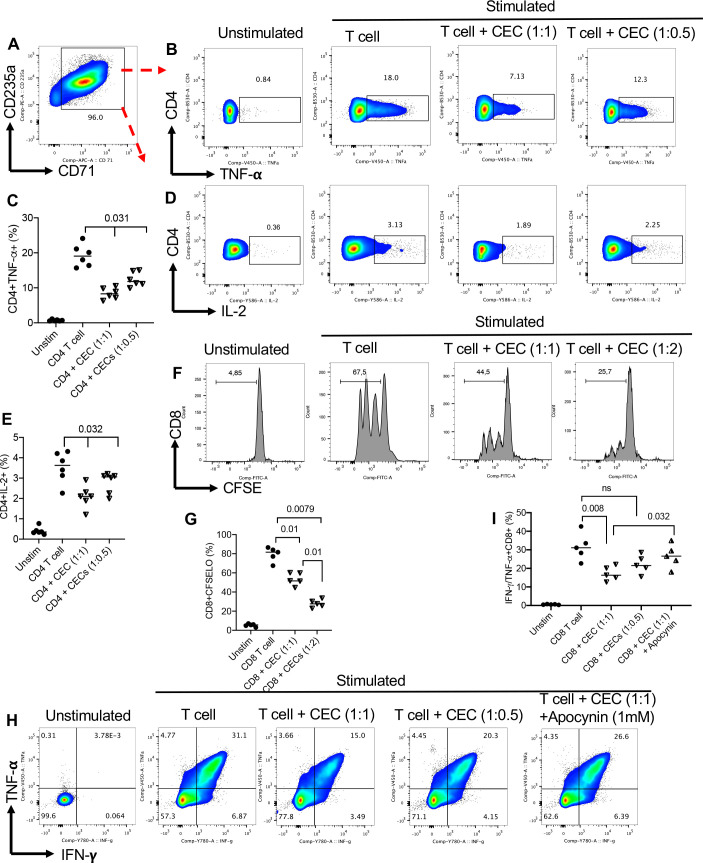
Figure 3.
CECs from the peripheral blood of patients with virus-associated solid tumors exhibit immunosuppression. (A) Representative flow cytometry plot showing the purity of isolated CECs from peripheral blood mononuclear cells of a patient with cancer. (B) Representative flow cytometry, and (C) cumulative data showing TNF-α expression in CD4+T cells in the absence or presence of CECs (at 1:1 or 1:05 ratio) on stimulation with anti-CD3/CD28 antibodies for 6 hours as measured by the intercellular staining (ICS). (D) Representative flow cytometry, and (E) cumulative data showing IL-2 expression in CD4+T cells in the absence or presence of CECs (at 1:1 or 1:05 ratio) on stimulation with anti-CD3/CD28 antibodies for 6 hours as measured by ICS. (F) Representative flow cytometry, and (G) cumulative data showing proliferation of CD8+T cells in the absence or presence of CECs (at 1:1 or 1:2 ratio) on stimulation with anti-CD3/CD28 antibodies for 3 days as measured CFSE. (H) Representative flow cytometry, and (I) cumulative data showing TNF-α/IFN-γ expression in CD8+T cells in the absence or presence of CECs (at 1:1 or 1:05 ratio) on stimulation with anti-CD3/CD28 antibodies for 6 hours as measured by the ICS. Each dot represents a patient and mean±SEM, p value as indicated for each data set. CEC, CD71+ erythroid cell; IFN, interferon; IL, interleukin; ns, not significant; TNF, tumor necrosis factor.

