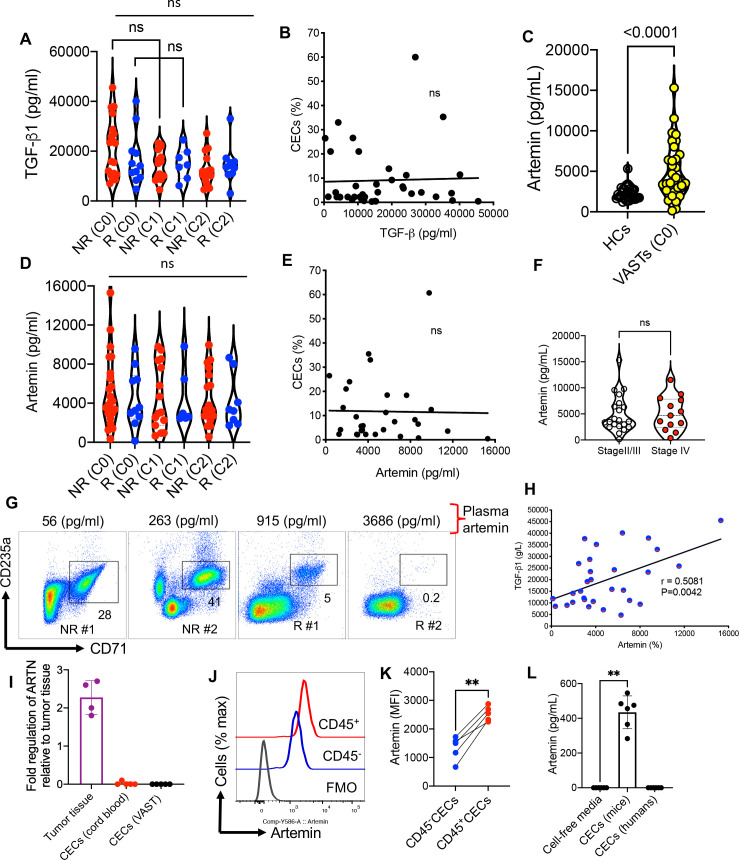
Figure 4.
Lack of association between CECs and ART/TGF-β1 but a direct correlation between the plasma concentrations of ART with TGF-β1. (A) The plasma TGF-β1 level in non-responders (NR) and responders (R) at different cycles. (B) The plot showing the correlation of TGF-β1 concentration with the frequency of CECs in PBMCs of patients with VAST (combined NR and R). (C) Comparing the concentration of ART in HCs versus patients with VAST. (D) The plasma ART level in NR and R at different cycles. (E) The plot showing the correlation of ART concentration in the plasma with the frequency of CECs in PBMCs of patients with VAST (combined NR and R). (F) Comparing the concentration of ART in patients with VAST (stages II/III vs stage IV). (G) Representative plots of % CECs with the plasma concentration of ARTN in two NR and two R. (H) The plot showing the correlation of ART with TGF-β1 concentration in the plasma of patients with VAST (combined NR and R). (I) Fold regulation of ARTN gene expression in tumor tissues and isolated CECs from human cord blood or patients with VAST. (J) Representative, and (K) cumulative data of ARTN expression in CD45−CECs versus CD45+CECs from the spleen of B16-F10 mice. (L) Cumulative data of ARTN concentrations in culture supernatants of CECs from B16-F10 splenic CECs or VAST-derived CECs after 48 hours culture. Each dot represents a patient or an animal and mean±SEM, p value as indicated for each data set or not significant (NS). ARTN, artemin; CEC, CD71+ erythroid cell; FMO, fluorescence minus one; HCs, healthy controls; MFI, mean fluorescence intensity; PBMC, peripheral blood mononuclear cells; VAST, virus-associated solid tumors; TGF, transforming growth factor.

