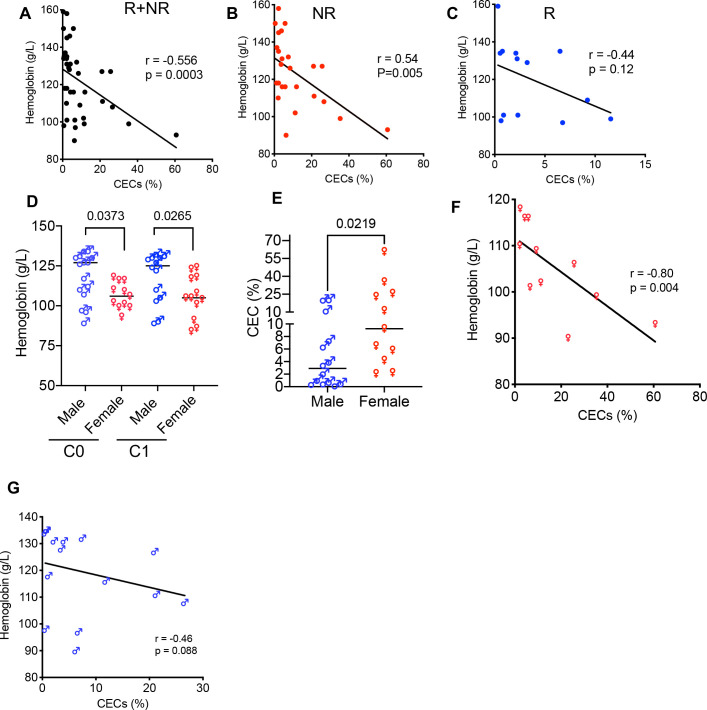
Figure 5.
Anemia is associated with a higher frequency of CECs. (A) Data showing an inverse correlation between the frequency of CECs in PBMCs with the concentration of blood hemoglobin (Hb) levels in both groups (NR+R), (B) only NR, and (C) R patients. (D) Cumulative data of the concentration of Hb in anemic male versus anemic female patients with VAST. (E) Cumulative data of the percentages of CECs in PBMCs of anemic male versus anemic female patients with VAST. (F) The plot showing an inverse correlation between the Hb concentration with the frequency of CECs in PBMCs of anemic women and (G) anemic men with VAST. Each point represents a human study subject. Mean±SEM, p value as indicated for each data set. CEC, CD71+ erythroid cell; NR, non-responders; PBMC, peripheral blood mononuclear cell; R, responders; VAST, virus-associated solid tumor.

