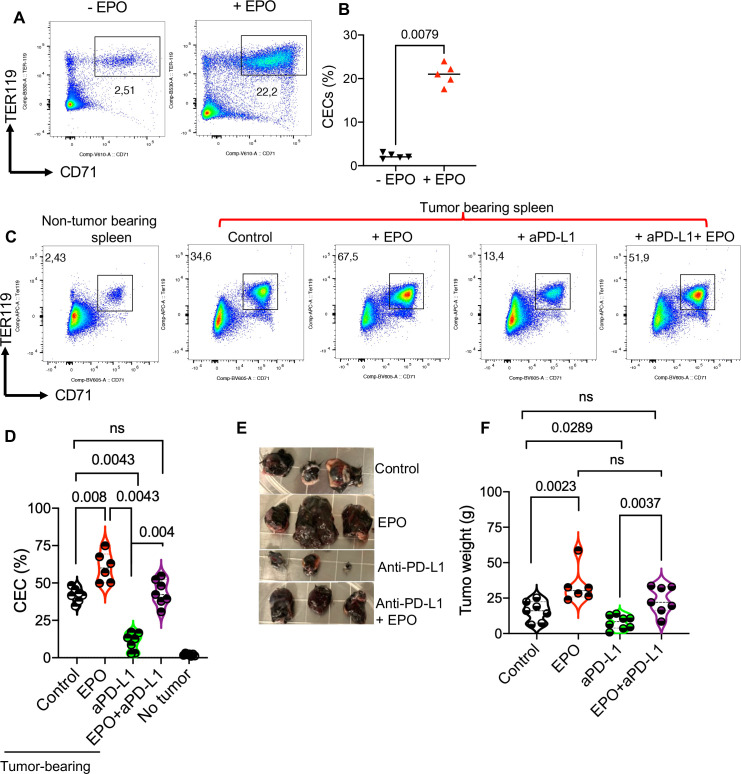
Figure 6.
EPO abrogated the therapeutic effects of anti-PD-L1 therapy via increased CECs. (A) Representative, and (B) cumulative data of the frequency of CECs in the spleen of untreated (− EPO) and treated mice with EPO (+ EPO). (C) Representative flow cytometry plots, and (D) cumulative data of the percentages of CECs in the spleen of cancer-free versus B16-F10 mice either untreated (control) or treated with EPO, anti-PD-L1, and the combination of anti-PD-L1/EPO. (E) Representative tumor size, and (F) and cumulative data showing tumor weight in different animal groups. Each point represents an animal. Mean±SEM, p value as indicated for each data set. Data are from two independent experiments. aPD-L1, anti-programmed death-ligand 1; CEC, CD71+ erythroid cell; EPO, erythropoietin; ns, not significant.

