Figure 2.
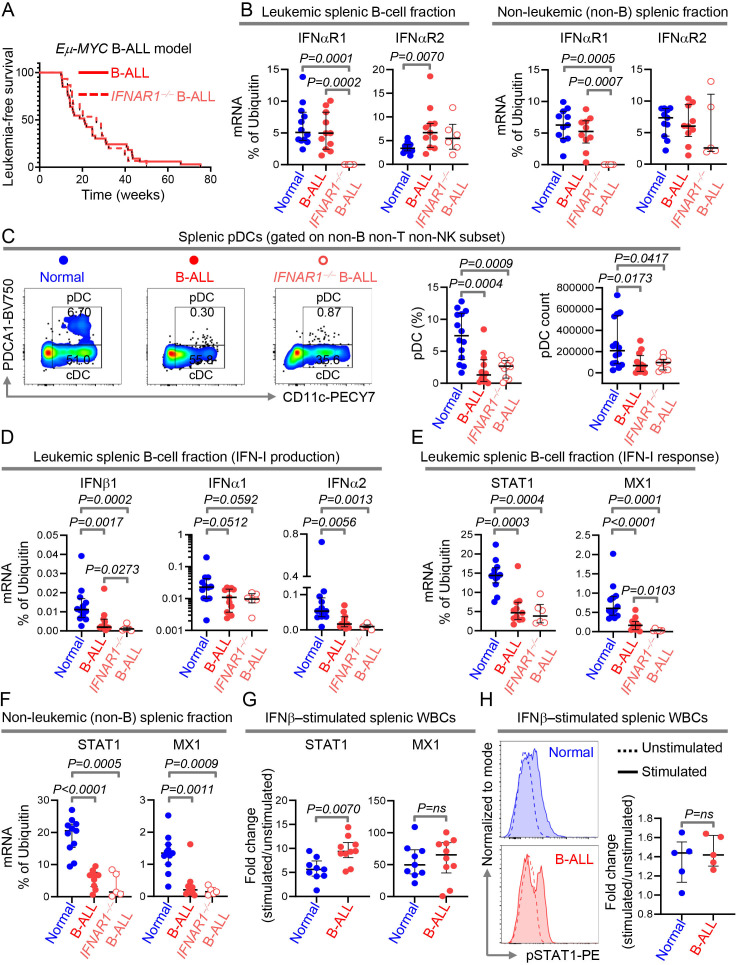
Intrinsic suppression of IFN-I production is sufficient to drive overt B-cell leukemogenesis. (A)Comparison of leukemia‐free survival between IFNAR1+/+ B-ALL-bearing (n=33) and IFNAR1−/− B-ALL-bearing (n=15) Eμ-Myc mice. (B)Quantitation of IFNαR1 and IFNαR2 transcript expression by qPCR in MACS sorted splenic B- and non-B cell fraction of wildtype (normal, B cell fraction, n=12; non-B cell fraction, n=11), IFNAR1+/+ Eμ-Myc B-ALL-bearing (B cell fraction, n=11; non-B cell fraction, n=10) and IFNAR1−/− Eμ-Myc B-ALL-bearing (B cell fraction, n=6; non-B cell fraction, n=5) mice. (C)Comparison of splenic pDC numbers and representative flow cytometry plots of normal (n=14), IFNAR1+/+ Eμ-Myc B-ALL-bearing (n=12) and IFNAR1−/− Eμ-Myc B-ALL-bearing (n=10) mice. (D–F)Quantitation of transcripts of IFNβ1, IFNα1 and IFNα2 in splenic B cells (D), and STAT1 and MX1 in splenic B- and non-B cell fractions (E, F)by qPCR. (G)Fold change in induction of STAT1 and MX1 transcripts after IFNβ stimulation in splenic WBCs of normal (n=9) and IFNAR1+/+ Eμ-Myc B-ALL-bearing (n=10) mice. (H)Histogram overlays and scatter plot showing the MFI and fold increase in MFI after IFNβ stimulation in splenic WBC from normal (n=5) and IFNAR1+/+ Eμ-Myc B-ALL-bearing mice (n=5). Ubiquitin (UB) was used as housekeeping gene in qPCR. For all flow cytometry experiments, one representative dot plot from each group is shown. Survival was calculated by Kaplan-Meier method and p value calculated by log-rank test. All other comparisons between any two groups were conducted using Mann-Whitney U test. Exact p values are provided whenever significant (<0.05) or trending to significance (0.05<p<0.1). B-ALL, B-cell acute lymphoblastic leukemia; MFI, median fluorescence intensity; pDC, plasmacytoid dendritic cell; WBCs, white blood cells.

