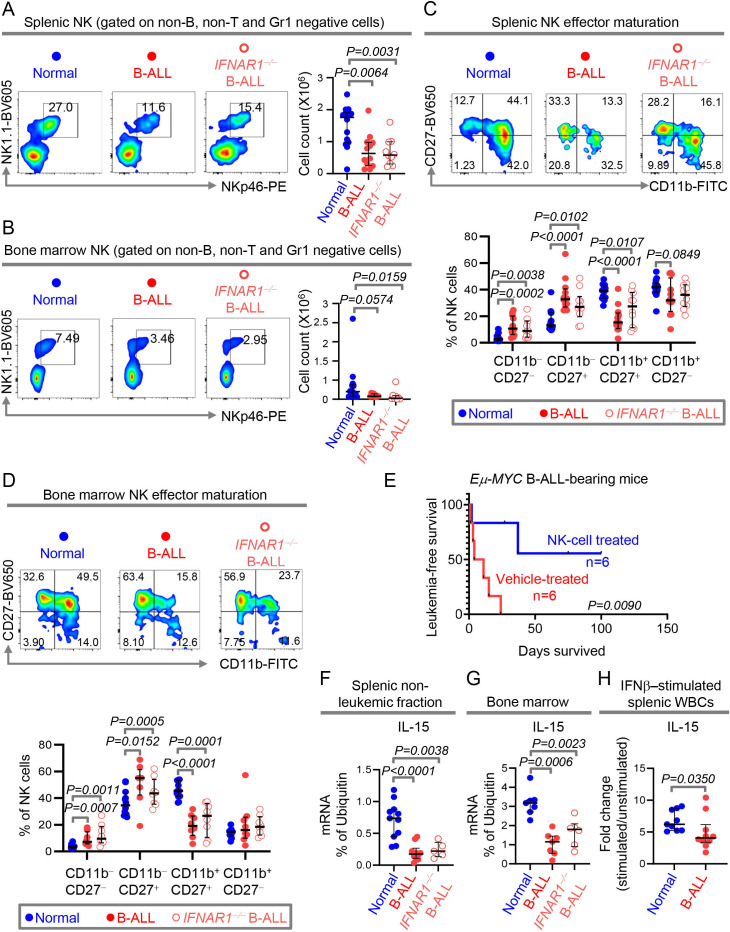
Figure 3.
Reduced IFN-I production in B-ALL is sufficient to suppress IL-15 and systemically impair NK surveillance. (A, B)Comparison of NK cell counts and representative plots of NK frequencies within the non-B, non-T and Gr1 negative cell fractions of the spleen (A)and bone marrow (B)of normal (spleen, n=14; bone marrow, n=12), IFNAR1+/+ Eμ-Myc B-ALL-bearing (spleen, n=12; bone marrow, n=8) and IFNAR1−/− Eμ-Myc B-ALL-bearing (spleen, n=10; bone marrow, n=8) mice. (C, D)Comparison of frequencies of NK subsets within the four-stage NK-cell effector maturation pathway in spleen (C)and bone marrow (D)of normal (spleen, n=14; bone marrow, n=12), IFNAR1+/+ Eμ-Myc B-ALL-bearing (spleen, n=12; bone marrow, n=8) and IFNAR1−/− Eμ-Myc B-ALL-bearing (spleen, n=10; bone marrow, n=8) mice. (E)Comparison of leukemia‐free survival between Eμ-Myc B-ALL-bearing mice treated with vehicle control or with syngeneic NK cells (n=6, each group). (F–H)Quantitation of IL-15 transcript expression by qPCR in MACS sorted splenic non-B cell fraction (F)and total bone marrow (G)of wildtype (normal, spleen, n=11; bone marrow, n=7), IFNAR1+/+ Eμ-Myc B-ALL-bearing (spleen, n=10; bone marrow, n=7) and IFNAR1−/− Eμ-Myc B-ALL-bearing (spleen, n=5; bone marrow, n=6) mice. (H)Fold change in induction of IL-15 transcript in IFNβ-stimulated splenic WBCs of normal (n=9) and IFNAR1+/+ Eμ-Myc B-ALL-bearing (n=10) mice. Ubiquitin (UB) was used as housekeeping gene in qPCR. For all flow cytometry experiments, one representative dot plot from each group is shown. All other pairwise comparisons between any two groups were conducted using Mann-Whitney U test. Exact p values are provided whenever significant (<0.05) or trending to significance (0.05<p<0.1). B-ALL, B-cell acute lymphoblastic leukemia; NK, natural killer; WBCs, white blood cells.

