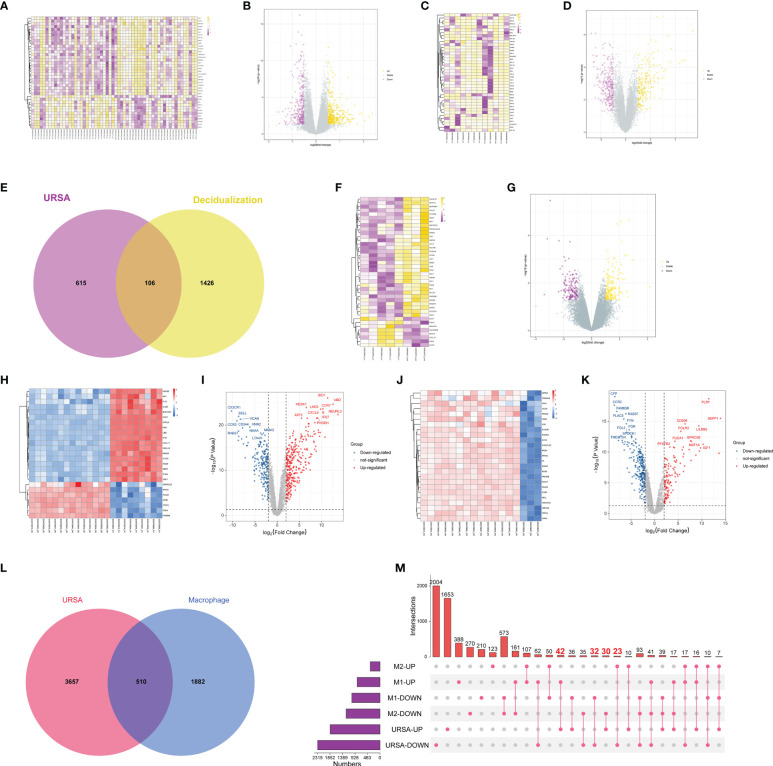
Figure 2.
Differential expression analysis on genes at maternal-fetal interface of URSA. (A) Heat map and (B) volcano plot visualized the decidua-DEGs of URSA. (C) Heat map and (D) volcano plot visualized the decidualization related genes. (E) Venn diagram showed DSCs-DEGs by intersecting decidua-DEGs and decidualization related genes. (F) Heat map and (G) volcano plot visualized the placenta-DEGs of URSA. (H) Heat map and (I) volcano plot visualized the DEGs screened from the M0 and M1 macrophages. (J) Heat map and (K) volcano plot visualized the DEGs screened from the M0 and M2 macrophages. Venn diagram (L) and upset diagram (M) showed the intersection of decidua-DEGs with macrophage polarization related genes and decidua-DEGs, namely macrophage polarization DEGs. In the heatmap, each row represented a DEG, each column represents a sample, and in the volcano plot, each dot represents a gene, in which yellow and red plot points represented upregulated genes, and purple plot and blue points represent down-regulated genes.

