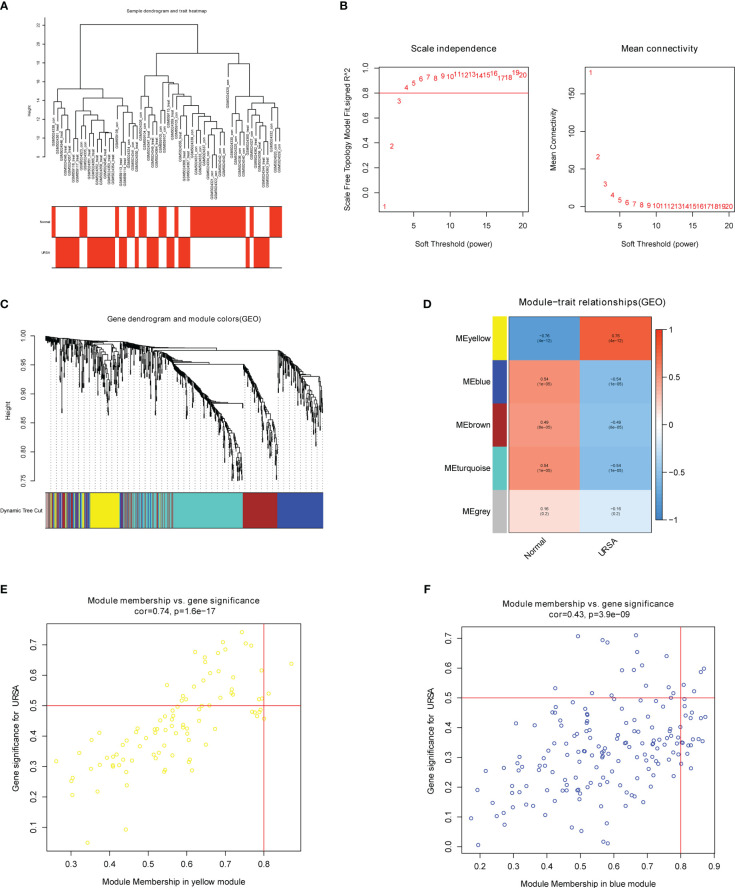
Figure 5.
WGCNA for macrophage polarization related genes (A) Clustering dendrogram of samples with trait heatmap. (B) Analysis of the scale-free fit index and the mean connectivity for various soft-thresholding powers. (C) Clustering dendrogram of genes by average linkage hierarchical clustering, in which 4 modules were identified. Each branch represents a gene, and each color underneath the branch represents a co-expression module. (D) Heat map visualizing the correlation between modules and RPL. (E, F) A scatter plot showing the correlationship between MM (X-axis) vs. GS (Y-axis) in the yellow and blue modules.

