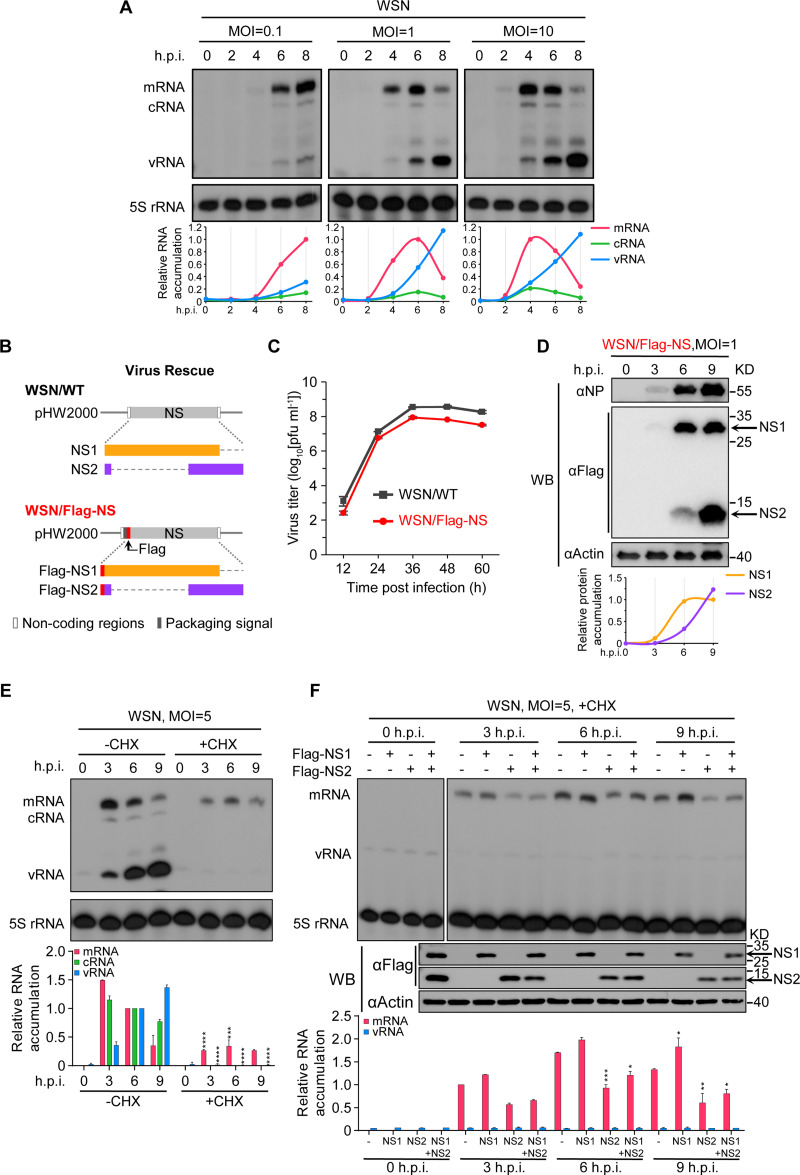
FIG 1.
Primary transcription can be differentially regulated by NS1 and NS2 proteins during influenza virus infection. (A) HEK 293T cells were infected with WSN virus at MOIs of 0.1, 1, and 10. The steady-state levels of viral RNAs were determined by primer extension analysis using primers specific for the NA segment at the indicated hours postinfection. The levels of 5S rRNA were used as internal controls. Data representative of results from three independent experiments are shown. (B) Schematic representation of the NS segments of WSN WT virus and Flag-NS virus. The Flag tag (red bars), NS1 (orange bars), and NS2 (purple bars) are indicated. The first 30 nucleotides of the NS ORF (the start codon ATG was mutated to CTC to avoid translation initiation) were added upstream of the Flag tag to maintain the packaging signal (dark-gray bar). (C) Growth curves of WSN WT virus and Flag-NS virus in MDCK cells infected at an MOI of 0.001. At the indicated time points, the supernatants were harvested, and the virus titers were determined by a plaque assay. The data represent the means ± standard deviations (SD) from three biological replicates. (D) HEK 293T cells were infected with WSN/Flag-NS virus at an MOI of 1. The levels of accumulation of the NS1 and NS2 proteins were analyzed by Western blotting at the indicated hours postinfection. β-Actin was detected as a loading control. Data representative of results from three independent experiments are shown. (E) Accumulation of viral RNAs in HEK 293T cells infected with WSN virus (MOI = 5) in the absence and presence of 100 μg mL−1 cycloheximide. (F) HEK 293T cells were transfected with plasmids expressing Flag-NS1 and/or Flag-NS2. At 24 hpt, cells were infected with WSN virus (MOI = 5) in the presence of 100 μg mL−1 cycloheximide. The steady-state levels of RNAs (E and F) and proteins (F) were determined by primer extension analysis (top) and Western blotting (WB) (bottom). The graphs in panels E and F show the relative mean intensities of viral RNAs normalized to 5S rRNA. The data represent the means ± SD from three biological replicates. Asterisks represent a significant difference from the control group (by one-way analysis of variance [ANOVA] with Dunnett’s post hoc test) (*, P < 0.05; **, P < 0.01; ***, P < 0.001; ****, P < 0.0001).

