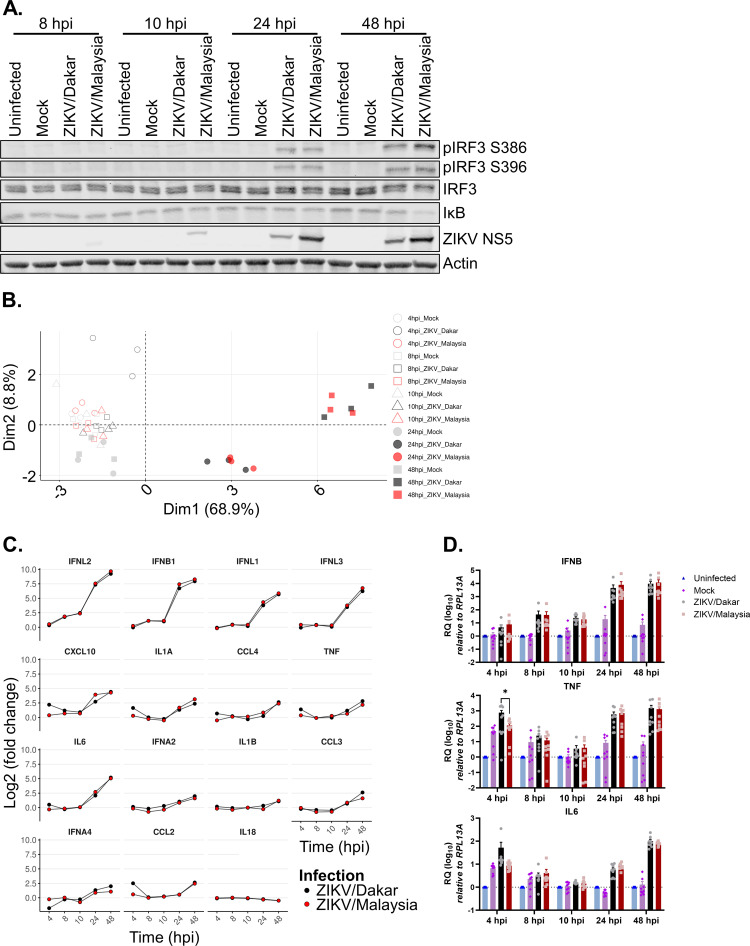
FIG 3.
ZIKV variants activate RLR signaling. (A and D) A549 cells were uninfected, mock-infected, or infected with ZIKV variants over a 48-h time course at an MOI of 5. (A) Cell lysates were analyzed via immunoblotting. Depicted is an immunoblot representative of three independent experiments (n = 3). (B and C) A549 cells were mock infected or infected with either ZIKV/Dakar or ZIKV/Malaysia over a 48-h time course at an MOI of 5. RNA lysates were collected, and transcript levels of cytokines and IFNs were quantified on the NanoString nCounter. Raw and processed expression data can be found in Table S1. Results are representative of three independent experiments (n = 3). (B) The PCA plot depicts changes in cytokine transcriptional profiles over the infection time course. (C) Log2 fold changes over mock infection in the transcript levels of GOIs are depicted individually for each gene. Statistical analysis was performed with a two-tailed t test followed by Benjamini-Hochberg (BH) correction for each time point. (D) RNA lysates were collected for qRT-PCR analysis. IFNB, TNF, and IL-6 transcript levels were normalized to the RPL13A housekeeping gene of uninfected samples at each time point. Results depict the means from three biological and technical replicates, which were pooled for statistical analysis; error bars represent SEMs. Statistical analysis was performed with a one-way analysis of variance (ANOVA) followed by Tukey’s multiple-comparison test for each time point. RQ, relative quantification.

