FIG 5.
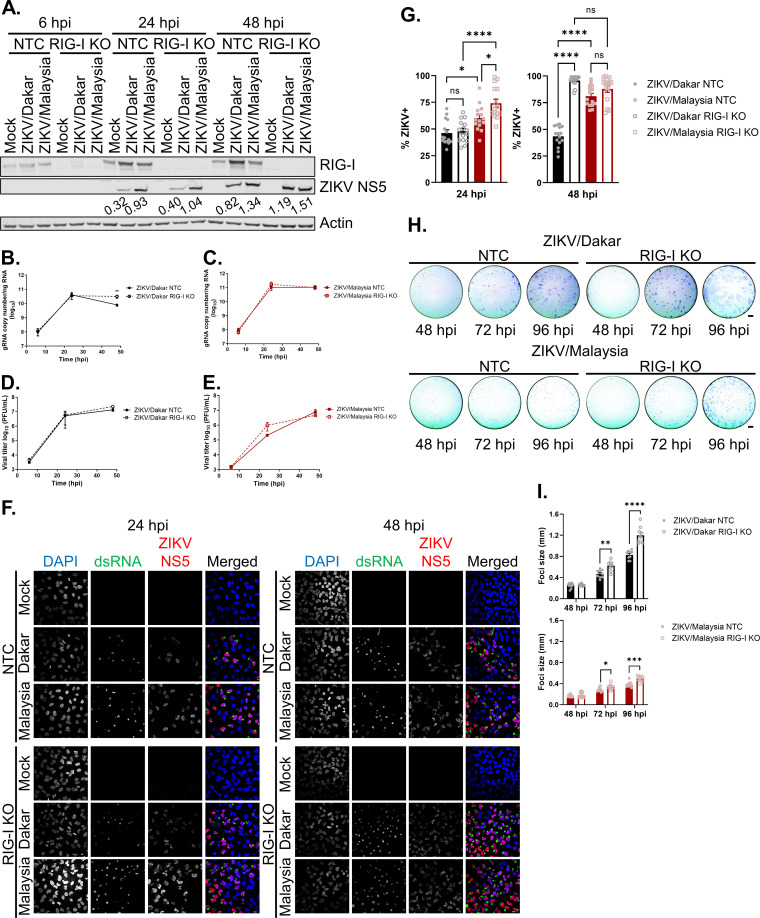
RIG-I-mediated signaling restricts the accumulation of ZIKV/Dakar proteins and viral genome and universally suppresses ZIKV spread. (A) A549 NTC and RIG-I KO cells were mock infected or infected with ZIKV/Dakar or ZIKV/Malaysia over a 48-h time course at an MOI of 5. Cell lysates were analyzed via immunoblotting. Depicted is one immunoblot that is representative of three independent experiments (n = 3). ZIKV NS5 immunoblot band intensities were quantified in Fiji and are indicated beneath the corresponding bands. (B to E) A549 NTC and RIG-I KO cells were infected with (B and D) ZIKV/Dakar or (C and E) ZIKV/Malaysia over a 48-h time course at an MOI of 5. (B and C) RNA lysates were analyzed by qRT-PCR to quantify viral copy numbers. Depicted are the means from three biological and technical replicates that were pooled for statistical analysis. Statistical analysis was performed with a two-tailed unpaired t test at each time point (**, P < 0.005). (D and E) Cell culture supernatants were analyzed by plaque assay to quantify the viral titers. Depicted are the means from two to three independent experiments (n = 2 to 3). Statistical analysis was performed with a two-tailed unpaired t test for each time point. (F and G) A549 NTC and RIG-I KO cells were infected with ZIKV/Dakar or ZIKV/Malaysia at an MOI of 5. Samples were analyzed by immunofluorescence staining for dsRNA and ZIKV NS5. For each sample, five randomly selected fields of view representing at least 300 cells total were analyzed. Images were manually analyzed using the multipoint tool in Fiji. Scale bar = 10 μm. The percentage of ZIKV+ cells (defined as dsRNA+ or NS5+) is presented after normalizing to the total number of cells as defined by DAPI staining. Depicted are the means of five randomly selected fields from each of the three independent experiments (n = 3). Data from five randomly selected fields from each of the three independent experiments were pooled for statistical analysis. Statistical analysis was performed with a one-way ANOVA followed by Tukey’s multiple-comparison test (ns, not significant; *, P < 0.05; ****, P < 0.0001). (H and I) A549 NTC and RIG-I KO cells were infected with serial dilutions of ZIKV/Dakar or ZIKV/Malaysia over a 96-h time course. Cells were fixed and stained for viral envelope protein to detect foci of infection. Depicted are representative images of foci from three independent experiments (n = 3). For each of the three technical replicates, the diameter of 10 randomly selected foci was measured. Scale bar = 1 mm. Graphs depict the means of 10 randomly selected foci from each of the three technical replicates across three independent experiments. Statistical analysis was performed with a two-tailed unpaired t test for each time point (*, P < 0.05; **, P < 0.005; ***, P < 0.001; ****, P < 0.0001). For all figures, error bars represent the SEM.

