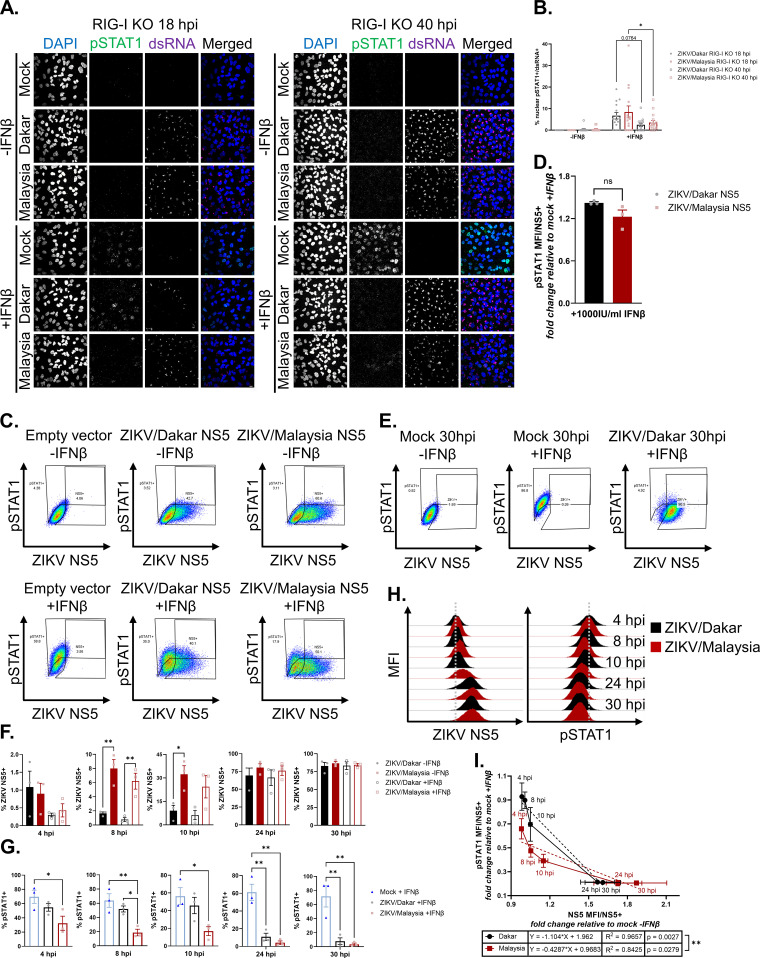
FIG 6.
Early accumulation of ZIKV/Malaysia NS5 confers enhanced ability to antagonize IFN-β signaling. (A and B) A549 RIG-I KO cells were mock infected or infected with ZIKV/Dakar or ZIKV/Malaysia at an MOI of 5 and then mock treated or treated with 100 IU/mL of IFN-β for 1 h for immunofluorescence analysis. For each sample, five randomly selected fields of view representing at least 310 cells total were analyzed. Z-stacks with a 2.5 μm step size were acquired and maximum Z-projections were generated in Fiji for manual analysis with the multipoint tool in Fiji. Scale bar represents 10 μm. The percentage of nuclear pSTAT1+ cells is presented after normalizing to the number of infected cells (defined as dsRNA+). Depicted are means of five randomly selected fields from three independent experiments (n = 3), which were pooled for statistical analysis with a two-way ANOVA followed by Tukey’s multiple-comparison test (*, P < 0.05). (C, D) HEK293T cells were transfected with an empty vector, ZIKV/Dakar NS5 construct, or ZIKV/Malaysia NS5 construct and treated with 1000 IU/mL of IFN-β for 8 h. (C) Gating strategy to identify transfected cells (defined as NS5+) and IFN responsive cells (defined as pSTAT1+). (D) pSTAT1 MFIs of transfected cells treated with IFN-β are normalized to pSTAT1 MFI of transfected, mock-treated cells. Depicted are means from three independent experiments (n = 3). Statistical analysis was performed with a two-tailed unpaired t test (ns: not significant). (E – I) A549 RIG-I KO cells were mock infected or infected with ZIKV/Dakar or ZIKV/Malaysia at an MOI of 5 over a 30-h time course and mock-treated or treated with 100 IU/mL of IFN-β for 30 min. Results are representative of three independent experiments (n = 3). (E) Gating strategy to identify infected cells (defined as NS5+) and IFN-responsive cells (defined as pSTAT1+). (F) Depicted is the mean percentage of infected cells of the total cell population. Statistical analysis was performed with a one-way ANOVA followed by Tukey’s multiple-comparison test (*, P < 0.05; **, P < 0.005). (G) Depicted is the mean percentage of pSTAT1+ cells of the total cell population. Statistical analysis was performed with a one-way ANOVA followed by Tukey’s multiple-comparison test (*, P < 0.05; **, P < 0.005). (H) Representative histograms of ZIKV NS5 and pSTAT1 MFIs of the total cell population during each infection time course. Gray dotted lines represent the centers of the histograms for ZIKV/Dakar-infected samples at 4 hpi as a reference point for visualizing the shift in NS5 and pSTAT1 histograms. (I) Depicted are the mean NS5 and pSTAT1 MFIs of the infected cell population over each infection time course. Statistical analysis was performed with linear regressions (**, P < 0.005). For all figures, error bars represent the SEM.

