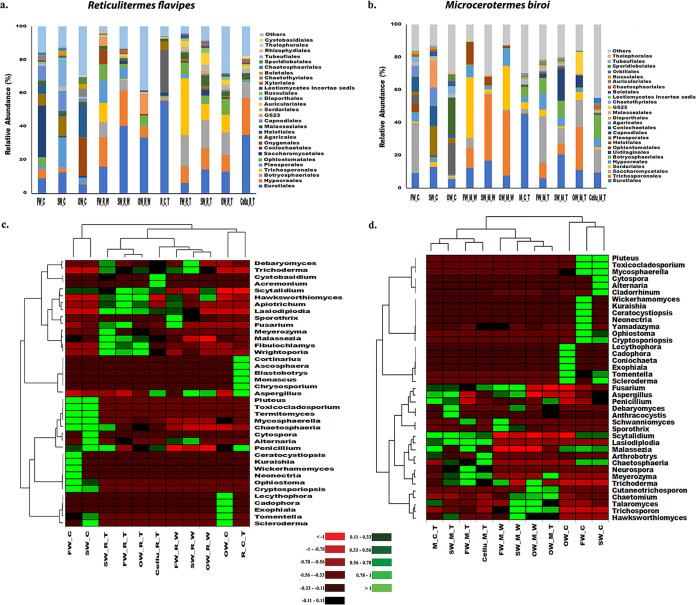
FIG 4.
Relative abundance of fungal communities. (a and b) Relative abundance of fungal order with relative abundance of ≥1% in at least one sample within termites (R. flavipes and M. biroi) upon feeding on different substrates, termite-infested wood and their controls. “Others” denotes the total relative abundance of rest of the fungal orders present. (c and d) Heatmap illustrating the top 39 fungal genera documented in Reticulitermes and Microcerotermes before and after feeding on different substrates, termite-infested spruce wood, and control wood. Color gradient from red to green through black represents the relative abundance of fungal OTUs present in each sample type. Red color denotes low abundance, green color signifies high abundance. Group abbreviations are the same as in Fig. 2.

