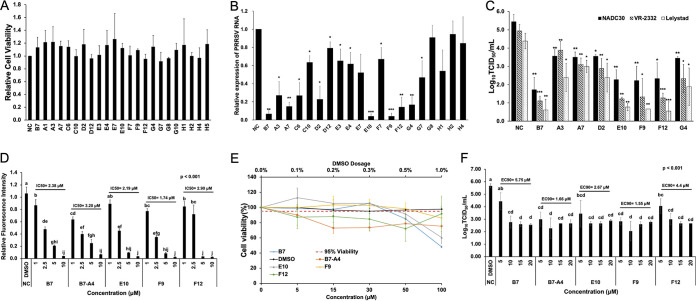
FIG 2.
The Combined GP2a/SRCR5 and GP4/SRCR5 BiFC assays accurately predict potent PRRSV-inhibitory compounds. (A) MTT analysis to the 20 positive compounds in PAMs. NC, DMSO Ctrl. Mean ± SD; n = 3. (B) qRT-PCR for PRRSV in total RNAs extracted from infected PAMs treated with various compounds. Values are normalized with GAPDH of PAMs, and the average of three strains (NADC30, VR-2332, and Lelystad) are plotted. Bars = mean ± SD; n = 3. *, P < 0.05; **, P < 0.01; ***, P < 0.001. (C) Titration assay results for PRRSV in the culture media of PAMs treated as described in panel B. Bars = mean ± SD; n = 3. *, P < 0.05; **, P < 0.01; ***, P < 0.001. (D) Relative fluorescence intensity of the SRCR5/GP2a BiFC assay for B7, B7-A4, E10, F9, and F12 at different concentrations. Mean ± SD; n = 3. P values are calculated by one-way ANOVA and letters on the top of bars indicate significant differences in Tukey post hoc test. (E) MTT analysis to B7, B7-A4, E10, F9, and F12 at different concentrations in PAMs. NC, DMSO Ctrl. Mean ± SD; n = 3. (F) Titration for PRRSV in the culture media from infected PAMs treated with B7, B7-A4, E10, F9, and F12 at different concentrations. Bars = mean ± SD; n = 3. P values are calculated by one-way ANOVA and letters on the top of bars indicate significant differences in Tukey post hoc test.

