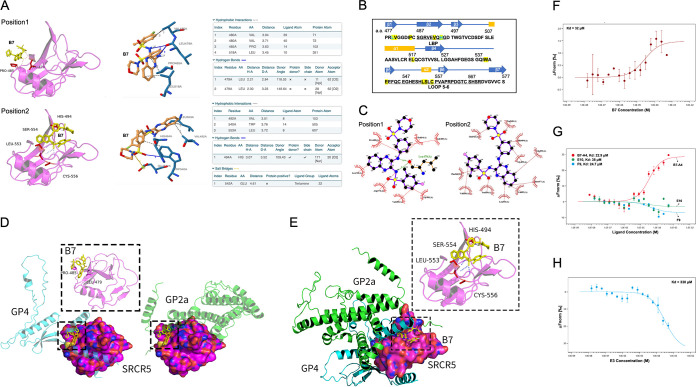
FIG 3.
Validating of physical interactions between the compounds and SRCR5. (A) Molecular docking (left) and PLIP (right) analyses depicting two potential interaction sites between compounds B7 and CD163-SRCR5 domain. (B) Residues in CD163-SRCR5 with potential interactions with B7 (yellow highlighted), residues forming potential hydrogen bonds with B7 are marked with green. The amino acids in the LBP and loop 5–6 regions are underlined. (C) Two-dimensional ligand-protein interaction diagram by LigPlot+ showing the hydrogen bond and hydrophobic interactions of B7 with SRCR5. (D) Molecular docking analyses by ZDOCK depicting the potential conformation of PPIs between SRCR5 with GP4 (left) or GP2a (right). B7 was placed in position 1 (boxes) to show the potential disturbing of both conformations. (E) Molecular docking analyses by ZDOCK depicting the PPI conformation between SRCR5 with both GP4 and GP2a. B7 was placed in position 2 (box) to show the potential disturbing of this conformation. (F) MST analysis of GFP-fused SRCR5 thermal dynamic association with ligand B7. Values represent Mean ± SD; n = 3. (G) MST analysis of GFP-fused SRCR5 thermal dynamic association with ligand B7-A4, E10, and F9. Values represent Mean ± SD; n = 3. (H) MST analysis of GFP-fused SRCR5 thermal dynamic association with ligand E3. Values represent Mean ± SD; n = 3.

