. 2023 May 17;25(21):14862–14868. doi: 10.1039/d3cp01215h

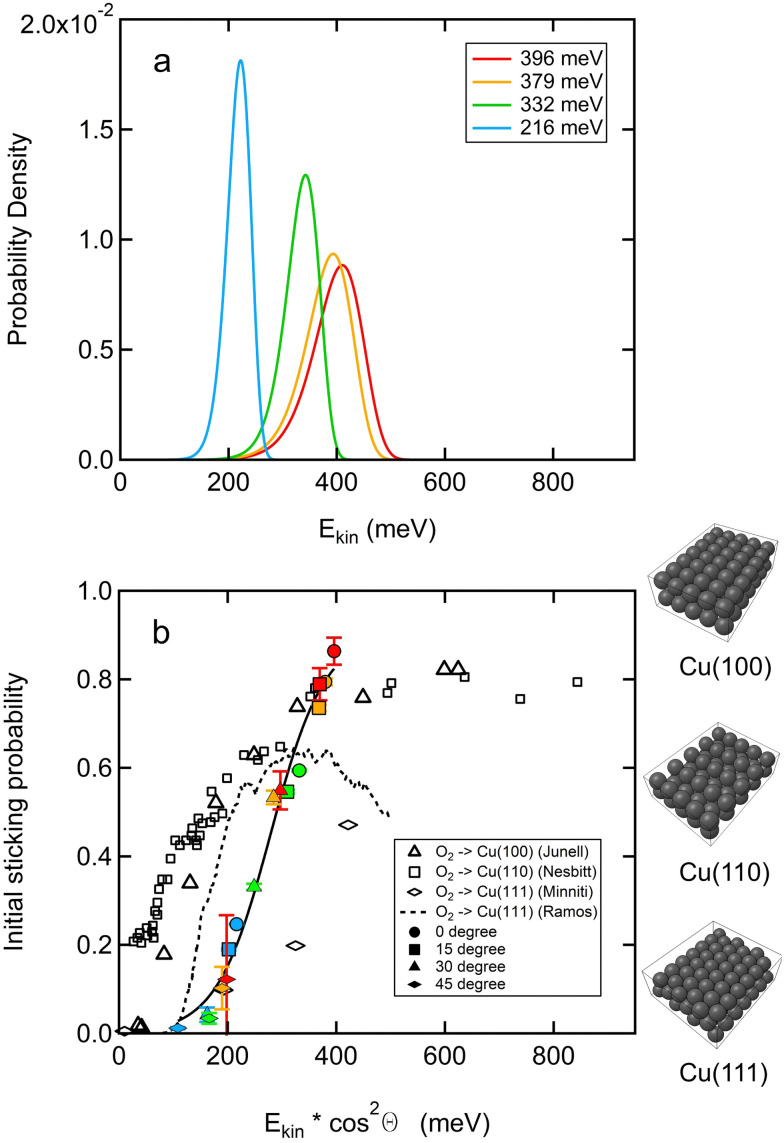
Fig. 1. (a) Kinetic energy distribution of various O2 supersonic molecular beams used in this study. Incident energies are indicated in the legend. (b) S0 at Tsurf = 300 K as a function of average normal incident kinetic energy (filled markers). The color coding reflects the different molecular beam energy distributions in a. Incident angles are indicated in the legend. Error bars reflect the uncertainty from the time-dependent fit for KW measurements as described in Fig. S1 (ESI). The experimental data for S0 as a function of average normal incident kinetic energy is fitted with the model given by Harris (solid black line).25 Previous experimental data for Cu(111) (open diamonds)21 and simulation (black dashed line).20 Also shown: experimental data for Cu(100) (open squares)19 and Cu(110) (open triangles).17.

Fig. 1