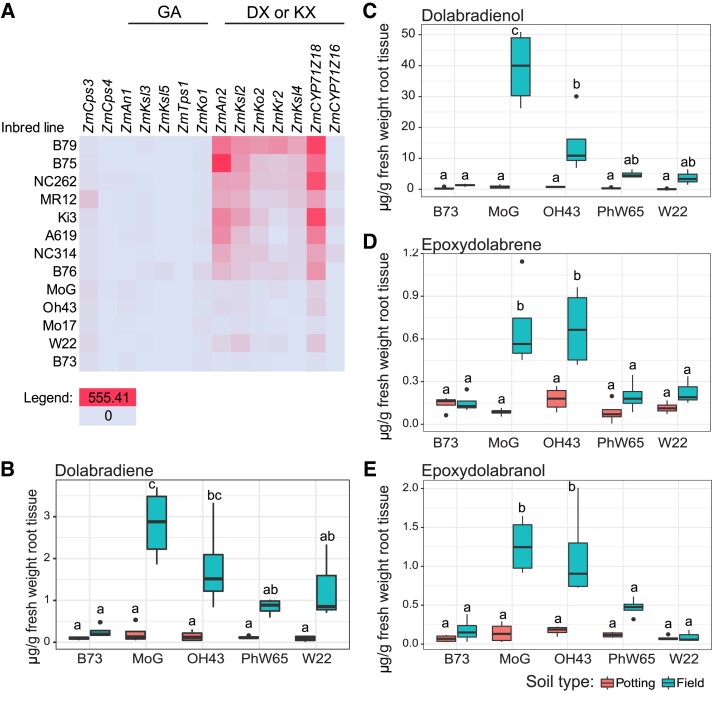
Figure 5.
DX root transcript and metabolite abundances vary across maize inbred lines. A) Transcript data is from Kremling et al. (2018). Data is sorted in descending order by ZmKsl4 expression in root tissues; color is scaled from the lowest (0 FPKM) in blue to highest (555.41 FPKM) in red in units of FPKM (fragments per kilobase of exon per million mapped fragments). B73 has averaged over 17 separate replicates. B-E) Metabolite levels using GC-MS and authentic standards for major DX in a subset of available inbred roots grown in a greenhouse in field soil or potting soil. The boundaries of the box in each boxplot represent the interquartile range; the edges of the box are the 25th and 75th percentiles, and the center line is the median. The upper and lower whiskers are the maximum and minimum values, respectively, that are within 1.5 times the interquartile range edges. Individual points are values greater than 1.5 times the interquartile range edges. Letters represent statistically significant differences measured by ANOVA and a t-test with a Sidak correction for multiple comparisons (P < 0.05).

