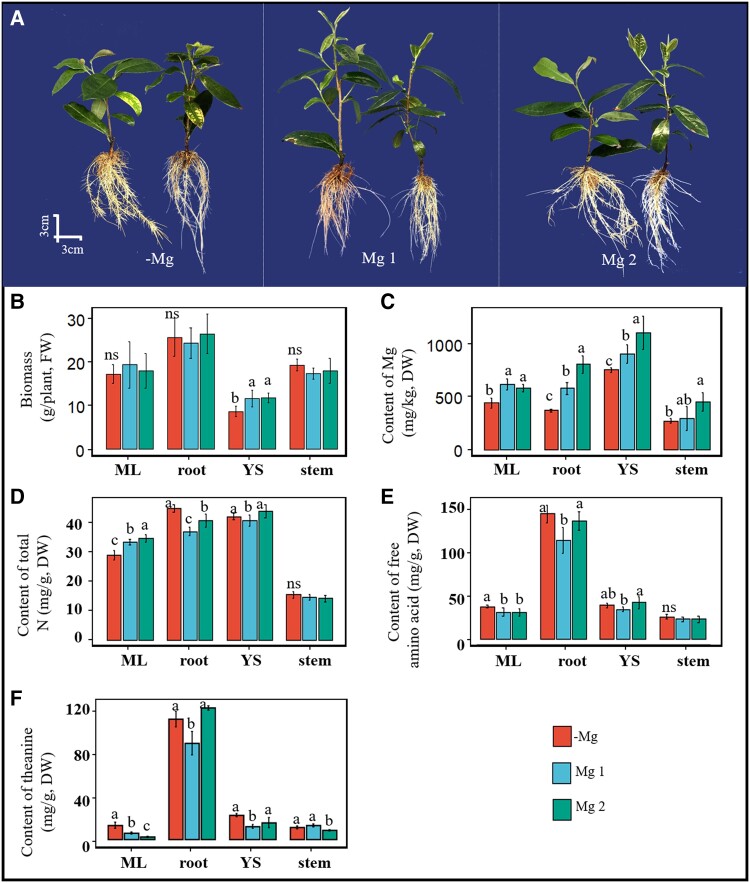
Figure 1.
Changes of biomass, Mg content, total N, free amino acid, and theanine content in tea plants under different Mg application levels. A) Phenotype of tea plants treated with Mg deficiency (−Mg) and Mg application (Mg1 and Mg2, full-strength nutrient solution). The images were digitally extracted for comparison. B) Biomass, C) Mg content, D) total N content, E) amino acid content, and F) theanine content in mature leaf (ML), root, young/new shoot (YS), and stem of tea plants treated with Mg deficiency (−Mg), Mg concentration in the full-strength nutrient solution (Mg1, 0.4 mmol/L), and 2 times the Mg concentration in the full-strength nutrient solution (Mg2). Individual images of plants were digitally extracted for comparison. Error bars show the mean values ± SD (n = 3). Statistical analysis was carried out with Duncan's multiple range test. Different letters indicate significant differences (P < 0.05). DW, dry weight; FW, fresh weight; ns, not significant.

