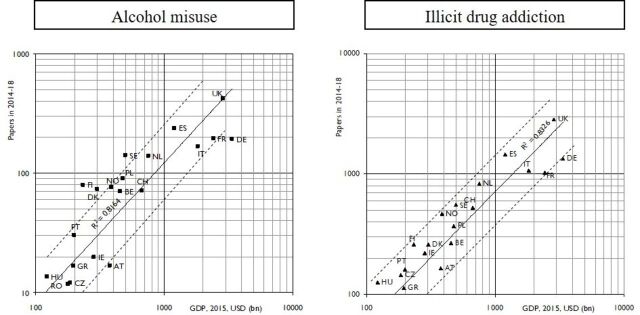
Figure 3.
Outputs on alcohol misuse (left graph) and illicit drug addiction (right graph) from EUR31 countries in 2014–2018 (see online supplementary table S1 for codes) against the GDP in 2015 on PPS. Dashed lines show values twice and a half of those expected from the regression line (which is based on values for 29 of 31 European countries). GDP, gross domestic product; PPS, purchasing power standard.

