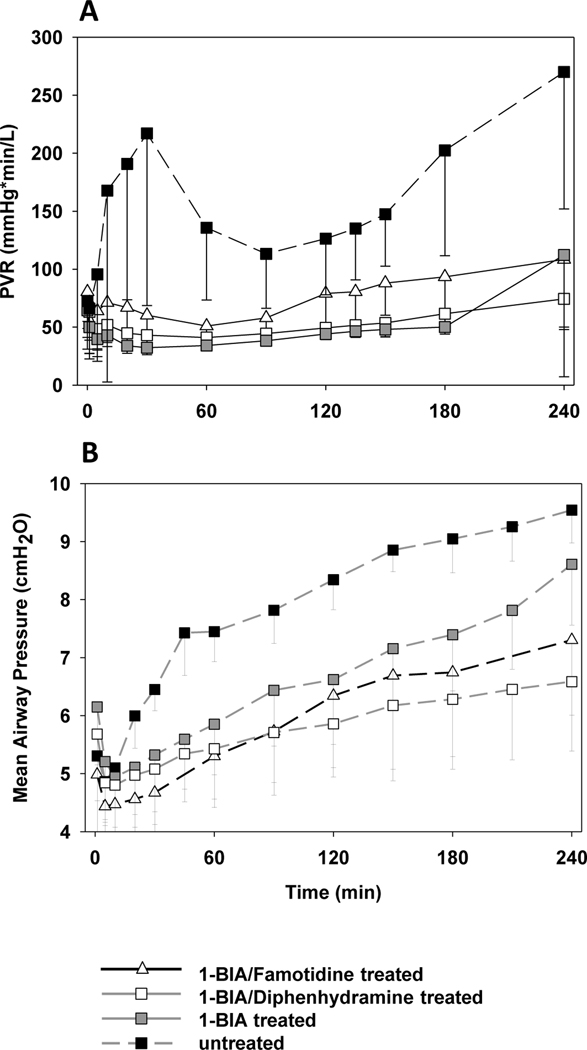
Figure 2. Pulmonary vascular resistance and airway pressure during perfusion.
PVR is expressed as a function of perfusion time, by experimental group (A). Time 0 represents measurements obtained during the first minute of lung perfusion. Organs in the 1-BIA treated groups maintained low and very stable PVR values, while untreated reference groups displayed bi-phasic PVR elevation, with a significant PVR rises at 30 minutes, and again during the last two hours of the 4-hour perfusion interval, a physiologic profile typical of thromboxane elaboration in other models (49). 1-BIA-treated groups show significantly lower PVR values between 20 and 240min of perfusion when compared to the untreated reference (* p<0.05). Airway pressures were significantly reduced throughout the perfusion when lungs were treated with 1-BIA alone or 1-BIA in combination with H1-blocker (B) (# p<0.05).

