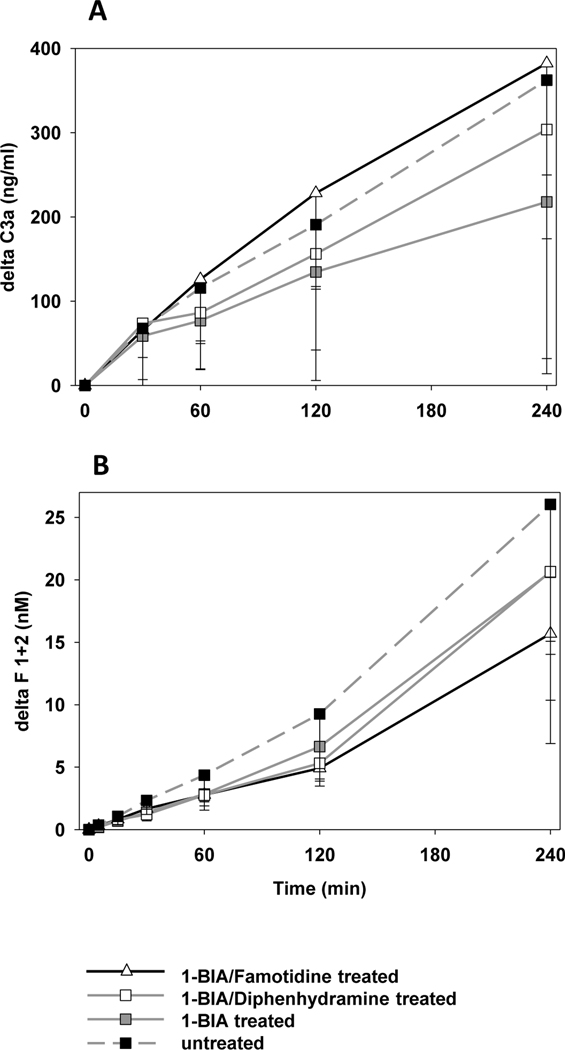
Figure 4. Complement and coagulation cascade activation.
(A) Plasma levels of complement activation byproduct C3a, expressed as the amount of complement fragments produced above the pre-perfusion baseline. All groups showed statistically similar complement activation during perfusion. (B) Activation of the coagulation cascade was detected by the formation of thrombin measured by plasma levels of fragments F1+2. In groups that had received 1-BIA treatment, ΔF1+2 values tended to be lower throughout the perfusion, but differences did not achieve statistical significance.

