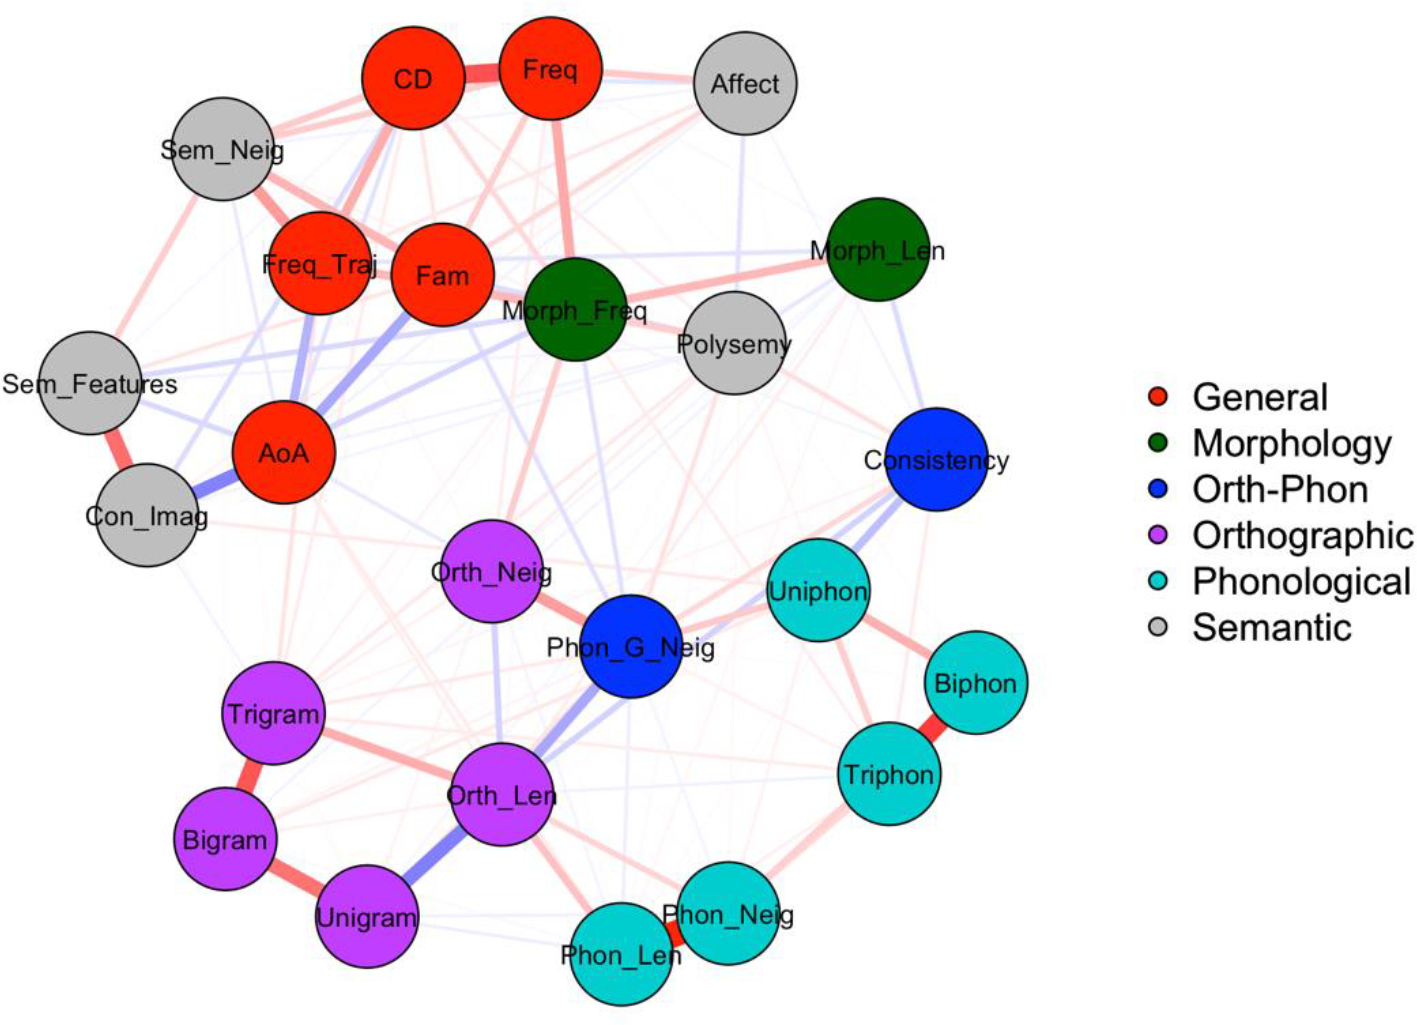
Figure 5.

Psychometric network model describing relationships between independent variables over 1,728 words. Line thickness refers to the edge strength, which is the size of the partial correlation between variables. Line colors indicate the sign of the correlation, in which red lines correspond to a positive correlation while blue lines correspond to a negative correlation.
