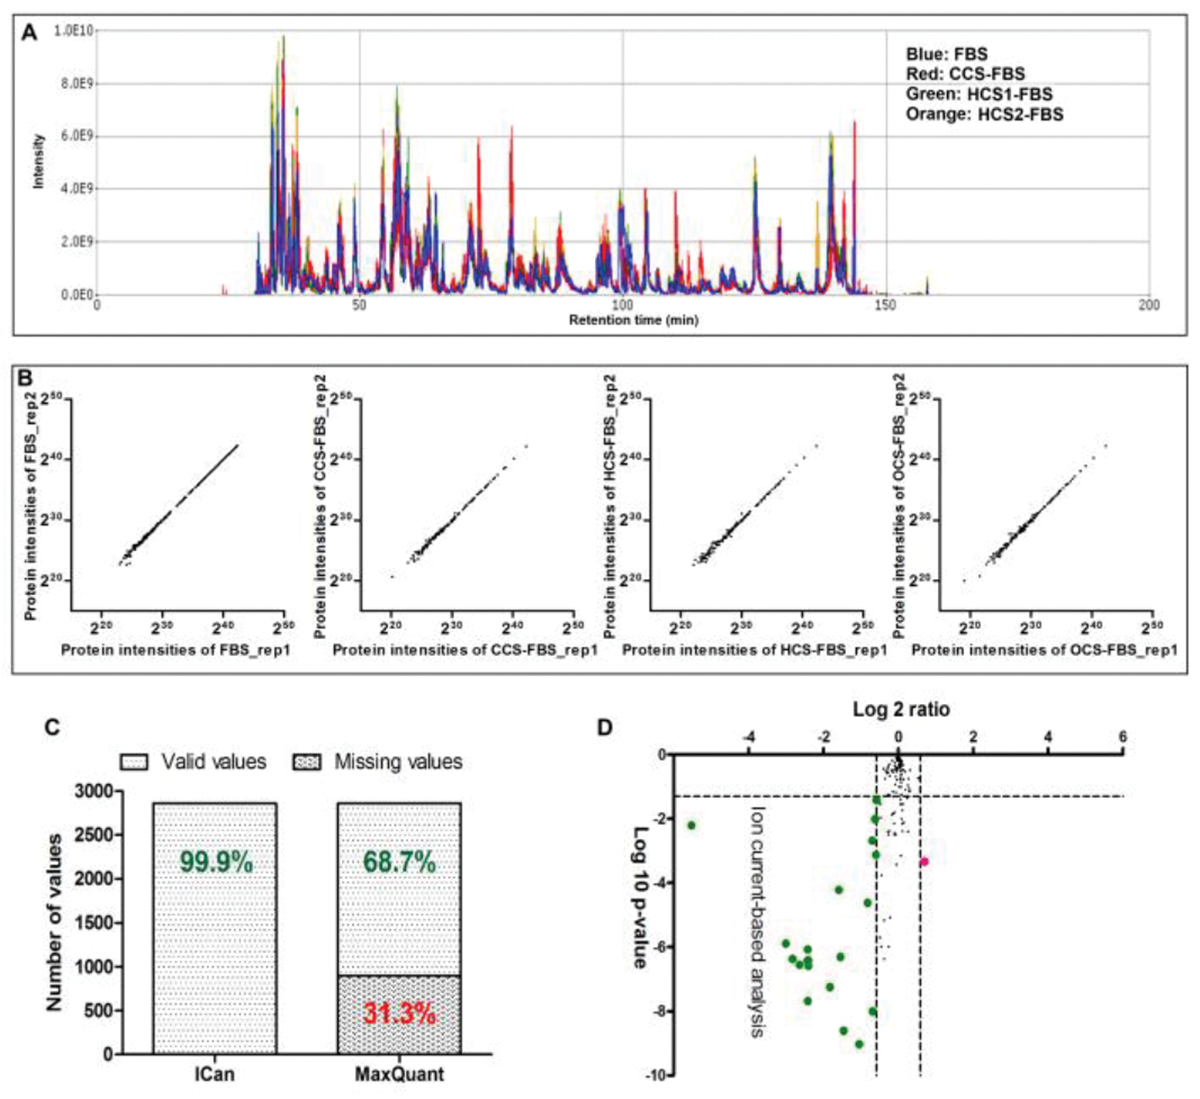
Fig. 4.

Evaluation of ion current-based quantitative analysis. (A) Peak alignment using SIEVE package (Thermo Fisher Scientific) for the twenty LC-MS analyses; (B) Protein quantitative values between 2 replicates within the same group; (C) Missing data by ion current-based analysis relative to MaxQuant; and (D) Volcano plot analysis (log10-transferred p-value versus log2-transferred ratio) of the comparison between FBS and paired HCS1-FBS. Thresholds were p value 0.05 and fold of change 1.5.
