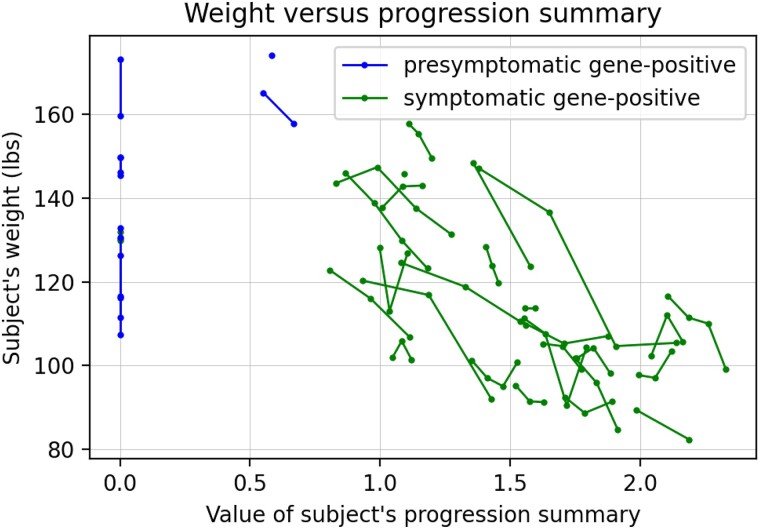
Figure 3.
Participant weight versus the progression summary. Successive timepoints for the same participant are connected by lines. Data shown for gene-positive males (n = 29 symptomatic, n = 7 pre-symptomatic). For A, B, C, these are estimates based on the symptom trajectory model; no statistical testing involved.

