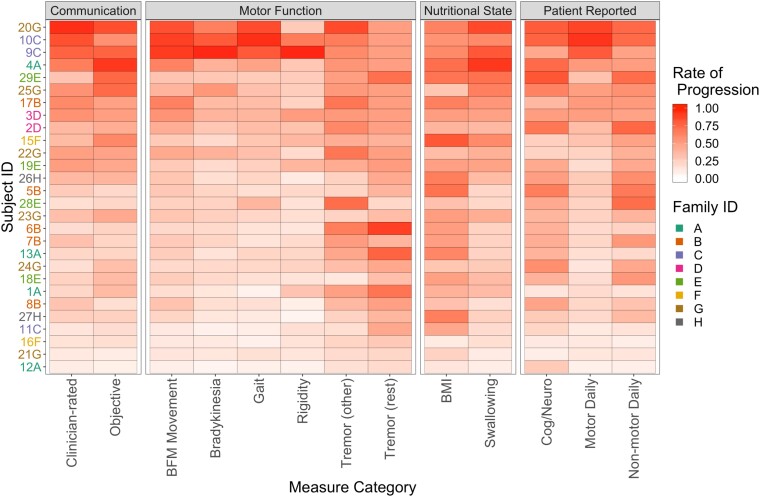
Figure 4.
Estimated rates of progression. Estimated rates of progression for each pre-defined category, for each symptomatic gene-positive subject, except for subject 14D. Subjects are ordered (highest to lowest) according to their average rate across the 13 categories. Estimates based on the rate heterogeneity analysis; no statistical testing involved.

