Fig. 6.
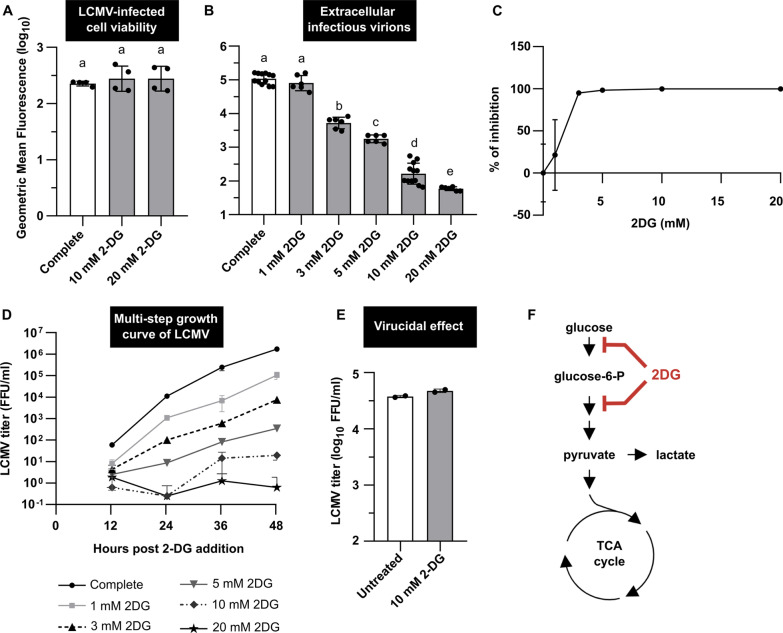
2-DG reduces LCMV infectious virion production in a dose-dependent manner. MRC-5 cells were infected with LCMV at an MOI of 3 (A–C) or MOI of 0.01 (D). After adsorption, the inoculum was removed and replaced with complete medium or complete medium supplemented with 2-DG (1, 3, 5, 10 or 20 mM). A Twenty-four hours after medium exchange, cell viability was measured by LIVE/DEAD™ Fixable Dead Cell Stain Kit. Data from four independent experiments are shown as a scatter of individual values. Mean and SD are shown as column and error bars, respectively. B LCMV titers in the extracellular media were determined by a focus-forming assay. Data from six to twelve independent experiments are shown as a scatter of individual values. Mean and SD are shown as column and error bars, respectively. Statistical differences between groups were analyzed using Welch’s ANOVA with Tamhane’s T2 post hoc test (A, B). Different letters above the columns indicate significant differences (P ≤ 0.05), while identical letters indicate no significant difference. C The relative (%) inhibitory effect of 2-DG on LCMV infection was calculated from LCMV titers shown in B (for more details, see Materials and methods). Data are shown as a mean and SD. D The multi-step growth kinetics of LCMV was determined from the viral titer analysis in the extracellular media at indicated times by a focus-forming assay. Data from two independent experiments are shown as a mean and SD. E Virucidal effect of 2-DG against LCMV (for more details, see Materials and methods). Data from two independent experiments are shown as a scatter of individual values. Mean and SD are shown as column and error bars, respectively. F Simplified schematic representation of glycolysis and tricarboxylic acid (TCA) cycle with highlighted targets of 2-DG. FFU/ml, focus-forming units per milliliter

