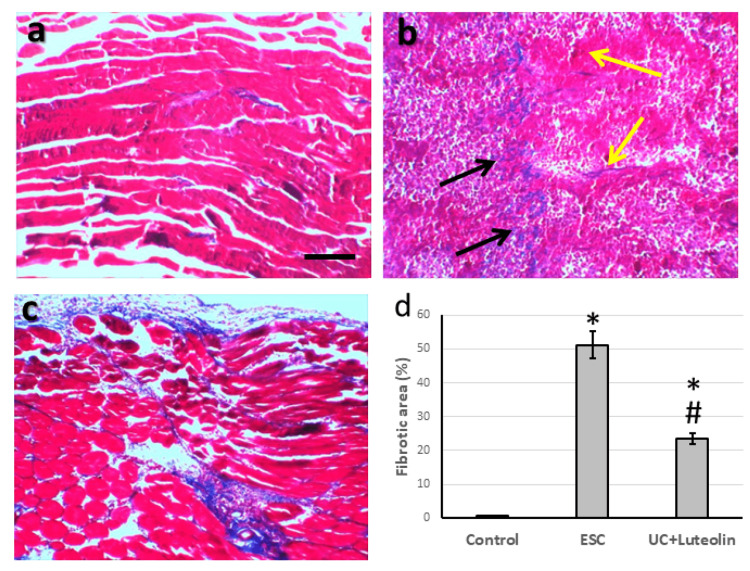
Figure 2. Muscle sections stained with Masson trichrome in control group (a), Ehrlich solid carcinoma (ESC, b) and ESC treated with 25 mg/kg luteolin (c). Fibrotic area was determined in 10 fields of high field power and expressed as mean ± standard deviation (d).
Black arrow represented loosely to densely packed collagen fibers in between neoplastic cells. Yellow arrows represented scattered papillary expansion of loosely blue band of collagen expression along the covering adipose connective tissue and extending in a fine strands in between muscle fibers.
*Significant difference as compared with the control group at p<0.05. #Significant difference as compared with ESC group at p<0.05. Scale bar 100 μm.

