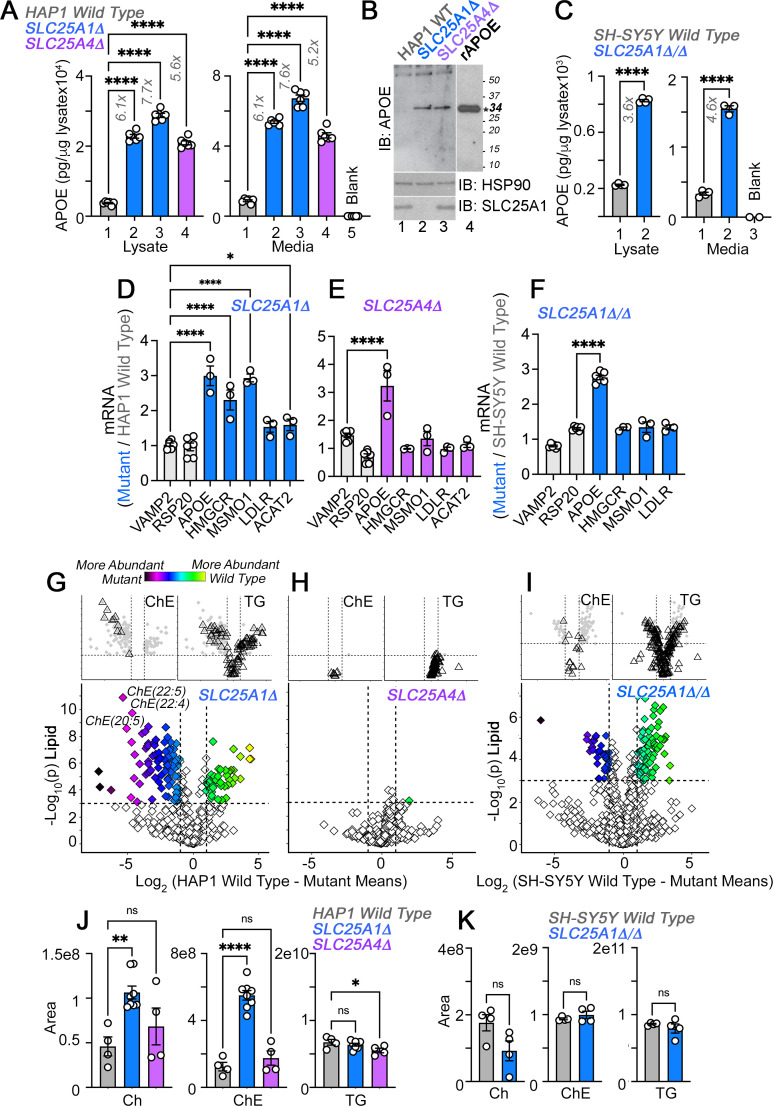
Figure 2. APOE transcripts and protein are upregulated independent from cholesterol levels in SLC25A1 and SLC25A4 mutants.
(A) MesoScale electrochemiluminescence solid phase ELISA determinations of human APOE in wild-type (column 1), SLC25A1Δ (columns 2 and 3), and SLC25A4Δ (column 4) HAP1 mutant cell lysates and conditioned media. Two independent SLC25A1Δ clones were tested (columns 2–3). Column 5 depicts complete media not exposed to cells. n=4. (B) APOE immunoblot of cellular extracts from wild-type, SLC25A1Δ, and SLC25A4Δ HAP1 mutant cells. HSP90 was used as a loading control. Lane 4 presents recombinant human APOE (rAPOE). In bold is the predicted molecular weight of rAPOE. (C) MesoScale ELISA measurements of human APOE in wild-type and SLC25A1Δ/Δ SH-SY5Y mutant cell lysates and conditioned media. (D–F) qRT-PCR quantification of APOE, sterol metabolism annotated genes, and housekeeping controls (VAMP2 and RPS20) in wild-type and diverse mutant cell lines. (D) and (E) show transcript levels in SLC25A1Δ and SLC25A4Δ HAP1 mutant cells, respectively. (F) depicts transcript levels in SLC25A1Δ/Δ SH-SY5Y mutant cells. All data are expressed as transcript ratio between mutant and wild-type. n=3 for D-F. (G–I) Volcano plots of positive mode untargeted lipidomics performed in SLC25A1Δ, SLC25A4Δ, and SLC25A1Δ/Δ mutant HAP1 and SH-SY5Y cells and their controls. Upper inserts present the distribution of cholesterol ester and triglyceride species marked by triangles. Depicted are log10 p values and log2 fold of change. n=4 per clone for the two SLC25A1Δ clones, n=4 for SLC25A4Δ, and n=4 for SLC25A1Δ/Δ. (J). Total cellular levels of free cholesterol (Ch), cholesterol ester (ChE), and triglycerides (TG) in wild-type, SLC25A1Δ, and SLC25A4Δ HAP1 cells. (K). Total cellular levels of free cholesterol (Ch), cholesterol ester (ChE), and triglycerides (TG) in wild-type and SLC25A1Δ/Δ SH-SY5Y cells. Average ± SEM, One-way ANOVA followed by Bonferroni or Holm-Šydák’s (D–F) multiple corrections, or unpaired t-test (K). See available source data for (B).
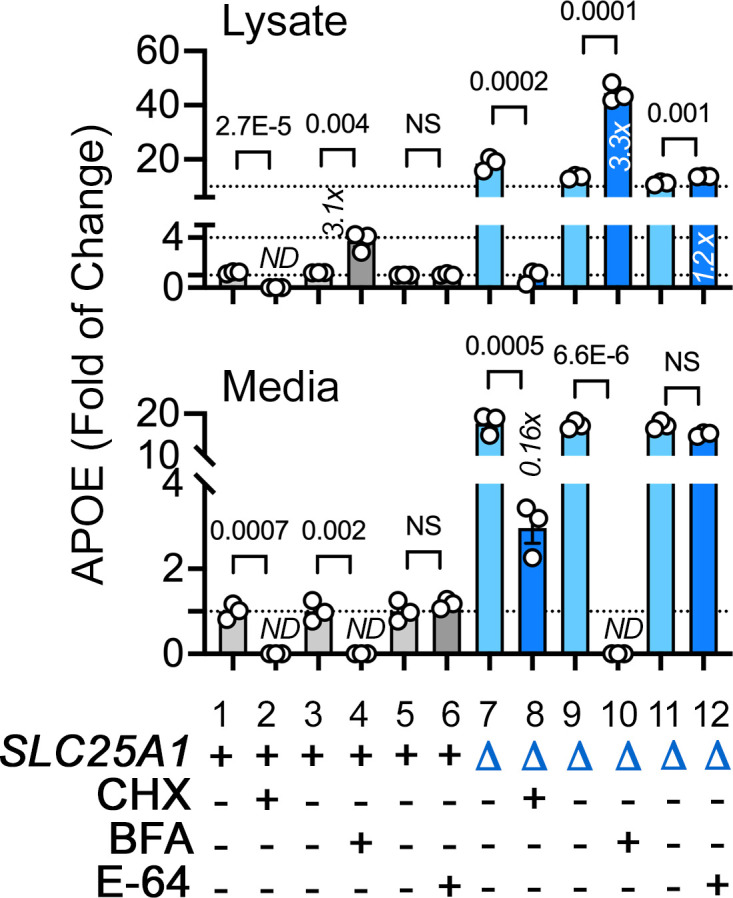
Figure 2—figure supplement 1. Effects of diverse mon-mitochondrial inhibitors on APOE expression and secretion.


