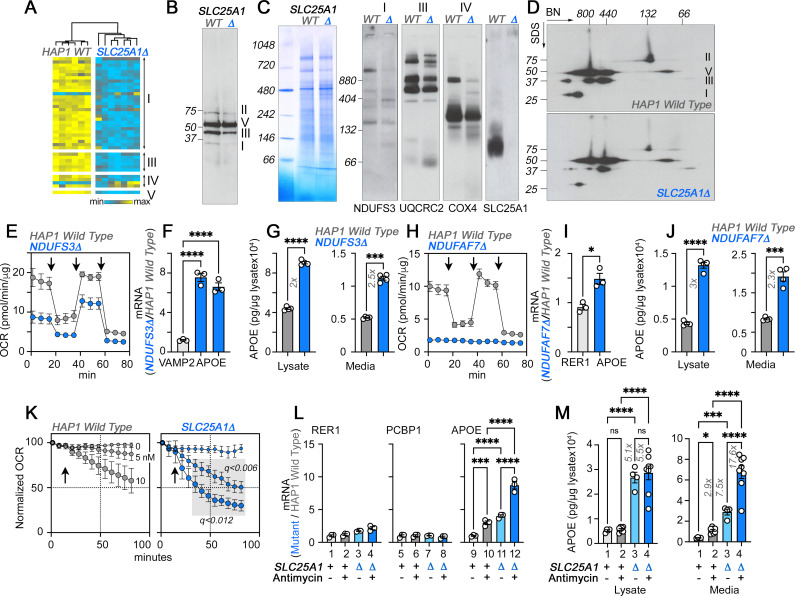
Figure 3. The integrity of respiratory chain complex I is required to control APOE expression.
(A) Expression of respiratory complex subunits in wild-type and SLC25A1Δ HAP1 cells quantified by TMT mass spectrometry. Kendal Tau hierarchical clustering analysis. (B) Immunoblots with OxPhos antibody mix in mitochondrial fractions from wild-type and SLC25A1Δ cells. (C) Blue native electrophoresis of mitochondrial fractions from wild-type and SLC25A1Δ cells. Shown are Coomassie stained native gel and immunoblots probed with antibodies against complex, I, III, IV, and SLC25A1. (D) Blue native electrophoresis followed by SDS-PAGE then immunoblot with antibodies against complex, I, II, III, and V in mitochondrial fractions from wild-type and SLC25A1Δ cells. (E–G). Seahorse stress test, APOE qRT-PCR, and APOE MesoScale ELISA analysis respectively in wild-type and NDUFS3Δ HAP1 cells. In (F), APOE was measured with two primer sets. (H–J) Seahorse stress test, APOE qRT-PCR, and APOE MesoScale ELISA analysis respectively in wild-type and NDUFAF7Δ HAP1 cells. VAMP2 or RER1 transcripts were used as controls in F and J. All qRT-PCR data are expressed as ratio between mutant and wild-type. (E to M) average ± SEM. One-Way ANOVA followed by Šydák’s multiple correction (F), or unpaired t-test with Welch’s correction (G, I, and J). Arrows in E (n=4) and H (n=3) show sequential addition of oligomycin, FCCP, and rotenone-antimycin during the Seahorse stress test. (K) SLC25A1Δ cells are more sensitive to antimycin than wild-type HAP1 cells. Wild type and SLC25A1Δ cells were exposed to vehicle or increasing concentrations of antimycin. Basal cellular respiration was measured for 90 min after additions (arrow) using Seahorse. Data are presented normalized to basal respiration in the absence of drug. Average ± SEM, n=3, Gray square shows significant differences between wild-type and SLC25A1Δ drug-treated cells as determined by multiple unpaired t-tests followed by corrections with the Benjamini-Krieger-Yekuiteli method (FDR = 5%). (L–M) APOE qRT-PCR and APOE MesoScale ELISA in wild-type and SLC25A1Δ HAP1 cells, respectively, treated with vehicle or antimycin. Twenty nM antimycin was used in qPCR experiments. Twenty to 80 nM was used in MesoScale ELISA experiments. RER1 (columns 1–4) and PCBP1 transcripts (columns 5–8) were used as housekeeping controls. All qRT-PCR data are expressed as ratio between mutant and wild-type. Average ± SEM, One-way ANOVA followed by Benjamini-Krieger-Yekuiteli multiple comparison corrections (FDR = 5%). See available source data for (B and C).


