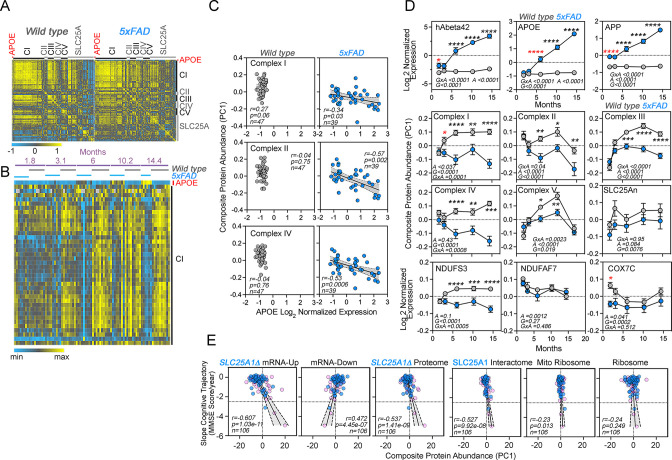
Figure 7. Correlative studies of APOE expression and electron transport chain subunits in an Alzheimer’s mouse model and aging humans.
(A) Protein expression similarity matrix of APOE, complexes I to V (CI-CV) of the electron transport chain, and transporters of the SLC25A family in wild-type and 5xFAD mouse models. Data were obtained by TMT mass spectrometry from mouse cortices. Similarity was calculated with Spearman Rank correlation. (B) Kendall Tau Hierarchical clustering of complex I subunits and APOE across ages and genotypes. (C) Correlation of composite protein abundance for complexes I, II, and IV in wild-type and 5xFAD mouse cortices with APOE levels. (D) Quantification of human A beta 42 peptide, APP, APOE, three mitochondrial Alzheimer’s risk factors (NDUFS3, NDUFAF7, and COX7C), and the composite protein abundance for complex I to V, as well as members of the SLC25A family of mitochondrial transporters in wild-type and 5xFAD mice (grey and blue symbols, respectively). Two-way ANOVA followed by Šídák’s multiple comparisons tests. Factors are age (A), genotype (G), and their statistical interaction (I). Asterisks denote significant differences between genotypes at a defined age. Red asterisks denote the earliest age with differences between genotypes. See Supplementary file 1 for all Mitocarta hits in the 5xFAD mouse study. (E) The SLC25A1 RNAseq, proteome, and interactome correlate with the cognitive trajectory of human subjects. Cytoplasmic and mitochondrial ribosome subunits were used as controls. Graphs depict the correlation between the cognitive trajectory (Mini-Mental State Examination (MMSE)) in subjects belonging to the Banner collection that were longitudinally followed for an average of 14 years (n=106) (Beach et al., 2015; Wingo et al., 2019). The SLC25A1Δ RNAseq, up and downregulated hits, proteome hits, as well as the SLC25A1 interactome hits principal components were derived by estimating eigenvectors of the expression matrix of protein abundance data. Best-fit regression line drawn in blue and the 99.9% confidence interval for the regression line shaded in gray. No covariate was applied because sex, age at enrollment, and education have been regressed out of cognitive trajectory (Wingo et al., 2019). Blue circles represent males, pink circles represent females (48.1%).
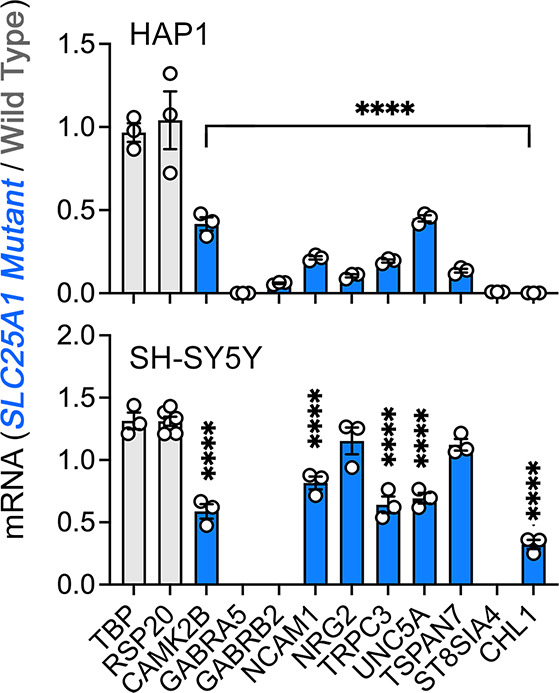
Figure 7—figure supplement 1. Interactions between SLC25A1 and NDUFS3 and neuronal ontology annotated genes downregulated in SLC25A1 mutant cells.


