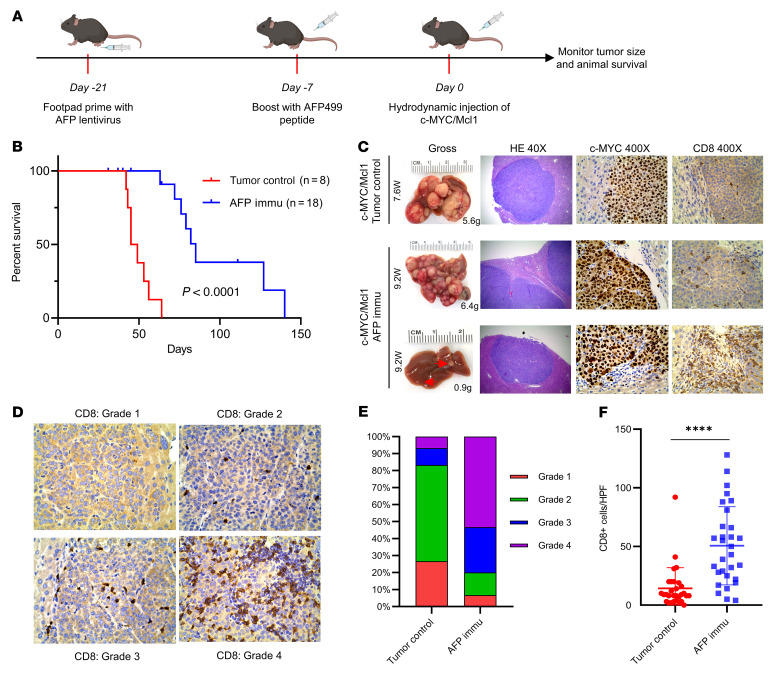
Figure 2. AFP immunization prevents the autologous HCC formation induced by c-MYC/Mcl1 hydrodynamic injection.
(A) Study design of AFP immunization and c-MYC/Mcl1 hydrodynamic injection. (B) Survival curve of the tumor control and AFP immunization group in c-MYC/Mcl1 mouse model. (C) Representative gross images and histopathological features of HE, c-MYC, and CD8 staining in the tumor control and AFP immunized group. The numbers indicate the liver weight and weeks from plasmid injections to the sacrifice date for that particular mouse. Original magnification, 40 × and 400 ×, as indicated in the column head. (D) The intensity of CD8 staining in C was graded from 1–4 based on the defined infiltrated CD8+ T cell number; Grade 1: 0–5 cells; Grade 2: 6–20 cells; Grade 3: 21–40 cells; Grade 4: > 40 cells. Original magnification, 400 ×. (E) The infiltrated CD8+ T cells were quantified in the tumor control and AFP-immunized groups (n = 30 high power fields). Kaplan-Meier test was used for survival analysis in B, unpaired 2-tailed Student’s t test was used in (F). Data are presented as mean ± SD. ****P < 0.0001. W, week(s); HPF, high power field; Immu, immunization.

