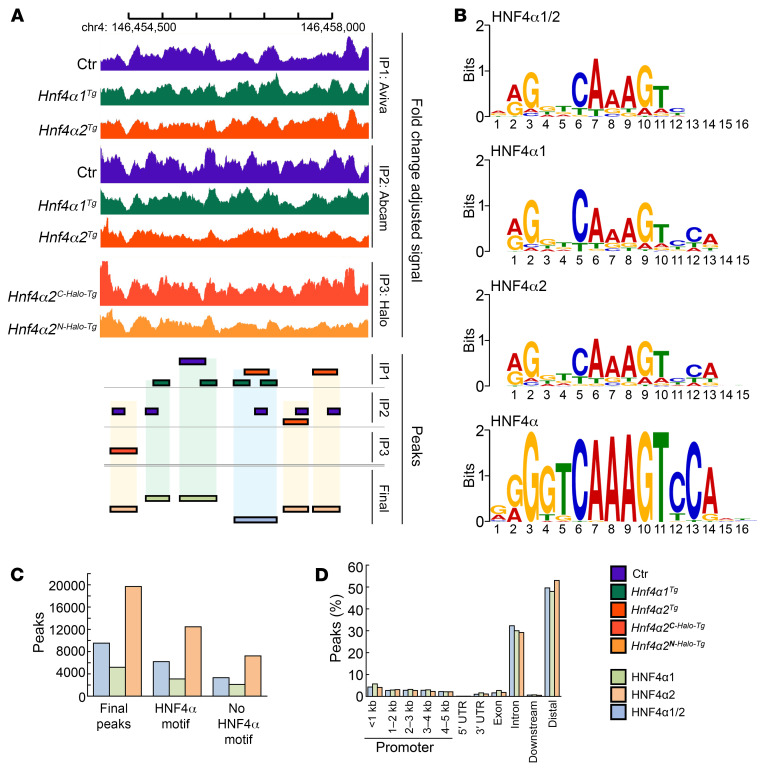
Figure 3. HNF4α-specific ChIP sequencing analysis of HNF4α targets in MC3T3-E1 osteoblasts.
(A) Representative illustration of final peak calls based on overlapping naive peaks found in MC3T3-E1 osteoblasts overexpressing an empty vector (Ctr), Hnf4α1 (Hnf4α1Tg), or Hnf4α2 (Hnf4α2Tg). (B) Enriched HNF4α motif sequences found in final peaks from position frequency matrices using MEME Suite (https://meme-suite.org/meme/tools/meme-chip) compared with the curated HNF4α consensus motif. (C and D) Number (C) and distribution across genomic regions (D) of HNF4α1, HNF4α2, or common HNF4α1/2 final peaks. n = 3 biological replicates per experimentally used antibody.

