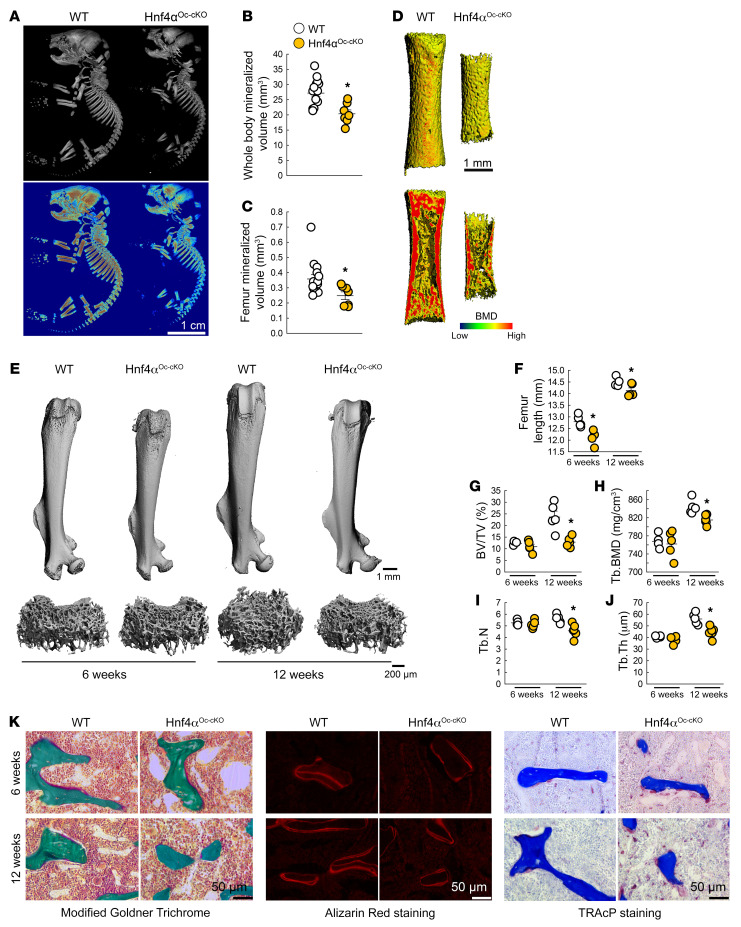
Figure 5. Bone-specific deletion of Hnf4α leads to low bone mass and impaired bone growth.
(A–J) 3D microtomography analysis of whole-body skeleton (A and B) and entire femur (C and D; bottom panel of D shows a longitudinal section) of WT and Hnf4αOc-cKO neonates, and of entire femur and femur metaphysis of young (6 weeks) and adult (12 weeks) WT and Hnf4αOc-cKO mice (E–J). BMD, bone mineral density; BV, bone volume; TV, total volume; Tb, trabecular; N, number; Th, thickness. (K) Microscopy analysis of modified Goldner Trichrome staining (left), alizarin red S staining (middle), and TRAcP staining (right) of femur trabecular bone from 6- and 12-week-old WT and Hnf4αOc-cKO mice. Values are expressed as the mean ± SEM. n ≥ 5 per group; P < 0.05 versus *age-matched WT. Statistical analysis was performed with unpaired Student’s t tests.

