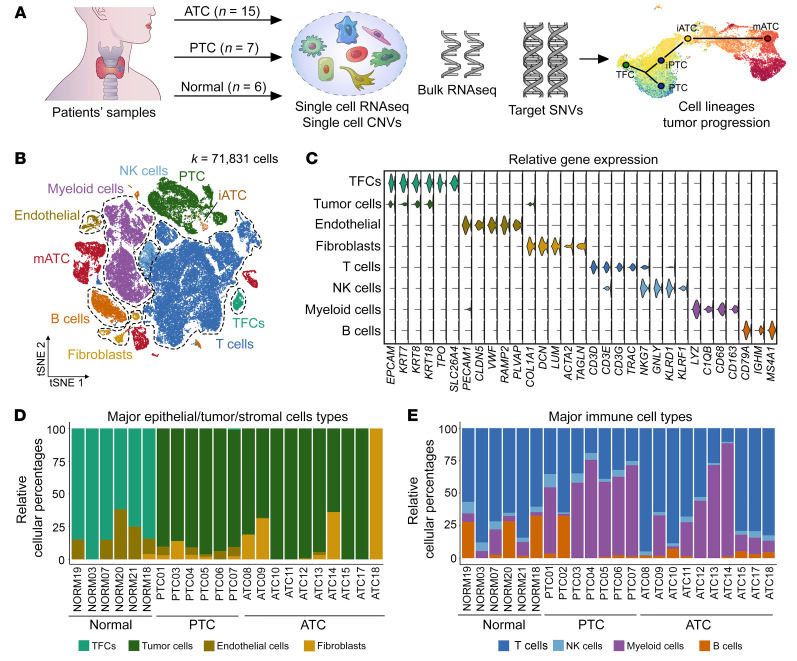
Figure 1. Single-cell profiles of thyroid tumor and normal tissues.
(A) Study design for all in-house data. (B) tSNE projection of single cells annotated with major cell types. Tumor cell subtypes (PTC, iATC, mATC) are color coded. (C) Violin plots of marker gene expression in 8 major cell types. (D and E) Stack bar plot of relative frequencies of nonimmune cells (D) and immune cells (E) in individual samples.

