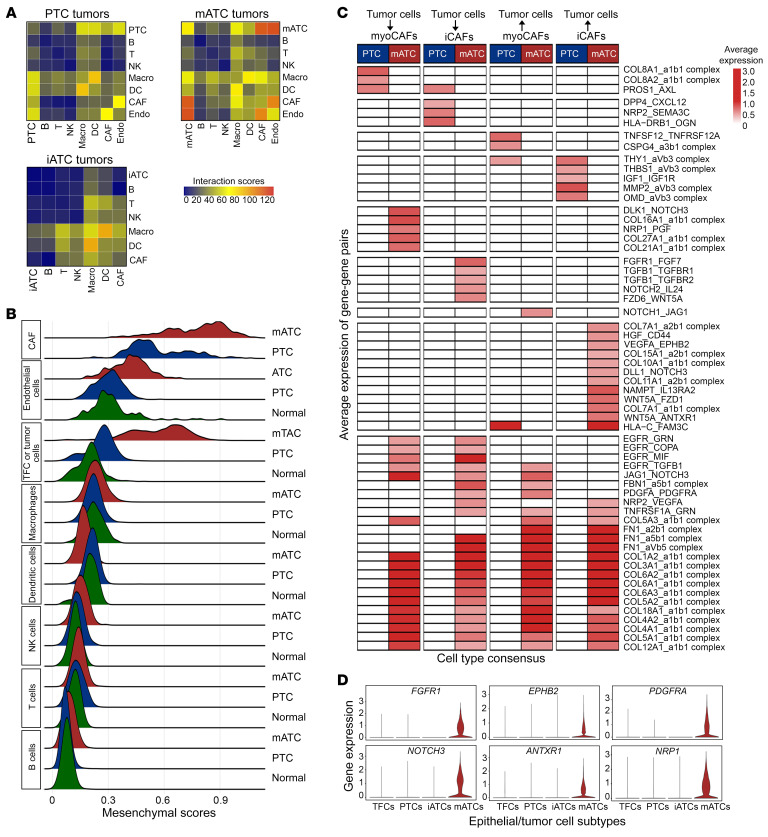
Figure 10. Dynamic changes in cell-cell interactions during ATC progression.
(A) Heatmaps of significant interaction pairs (P < 0.05, by 1-sided permutation test) between major cell types in PTC, iATC, and mATC. (B) Ridgeline plots of mesenchymal scores for major cell types in mATC (red), PTC (blue), and normal tissues (green) after SoupX. (C) Heatmap showing average expression (avg.exp) levels of uniquely significant ligand-receptor pairs between tumor cells and CAFs in PTC and mATC . The blanks represent nonsignificant interactions. P < 0.05, by 1-sided permutation test; mean expression ≥0.5. (D) Violin plots of selected receptors in mATC cells contributing to the interaction between tumor cells and CAFs in ATC samples.

