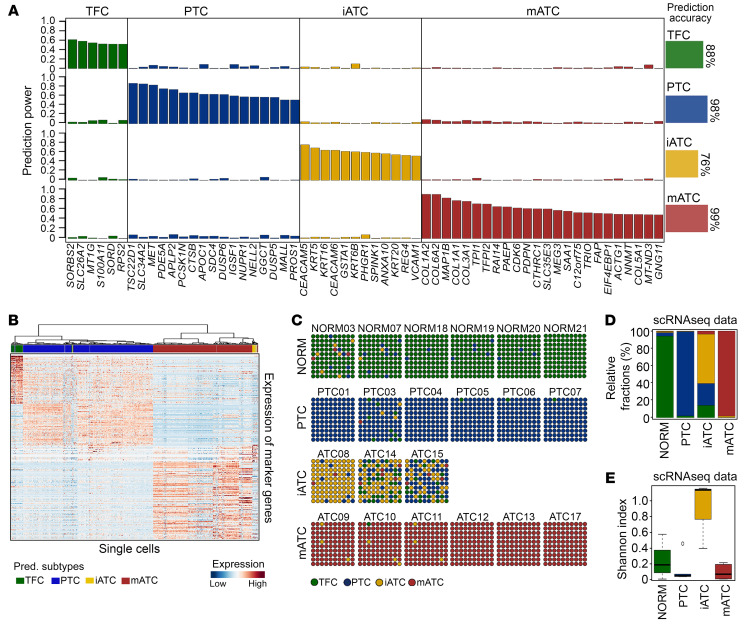
Figure 2. Coexistence of epithelial cell subtypes in thyroid cancer.
(A) Bar plot of the prediction powers of a 59-gene predictor selected by the lasso model, with the averaged prediction accuracies per subtype. (B) Heatmap showing unsupervised clustering of single cells. (C) Dot plots depicting predicted subtype compositions in each sample. Each dot represents 1% of the cells. (D) Stacked bar plot of relative fractions of 4 epithelial cell subtypes. (E) Box plot of the Shannon Diversity Index. All boxes are centered at the median and bounded by the first (Q1) and third (Q3) quartiles. Upper whiskers indicate the minimum (maximum, Q3 + 1.5 IQR), and lower whiskers indicate the maximum (minimum, Q1 – 1.5 IQR). NORM, normal.

